已更新
ICX is possibly looking for a move up.
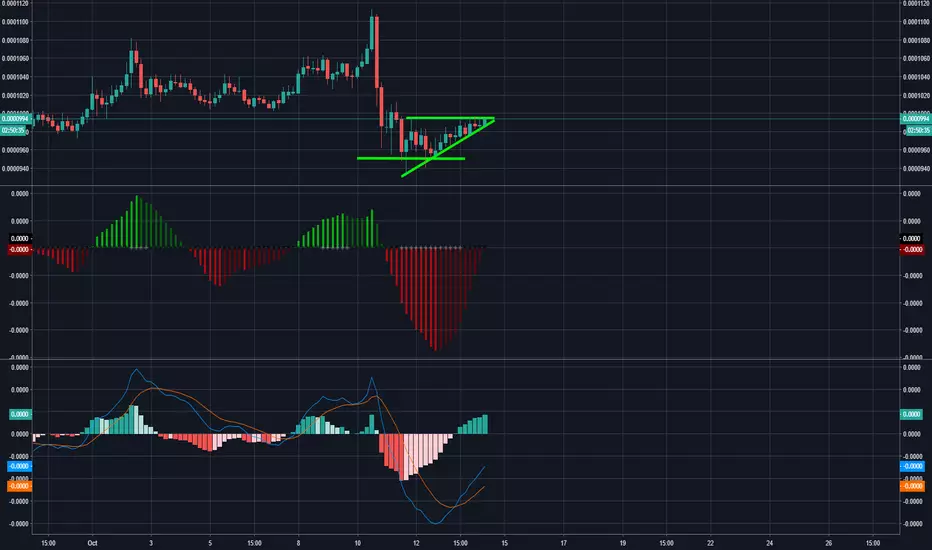
ICX/BTC appears to be within an ascending triangle pattern. We got a nice bounce off of a previous support zone around 950 sat's, and we've been on a steady up-trend on the 4-hour chart. So long as Bitcoin holds steady, we could see a 5-10% move in ICX in the next few days. Good Risk/Reward on this trade in my opinion.
On the 4-hour indicators, ICX got a bullish MACD crossover on October 13th, and the Squeeze Momentum Indicator is showing upward movement. RSI also just crossed into bullish territory as it sits at 51.
Entry: 985-995
Target: 1070-1085.
Stop loss (tight): 970
Stop loss (loose): 925
--This is not financial advice. Always do your own research and come to your own conclusions before buying/investing, as investing in cryptocurrencies comes with high risk and high amounts of volatility .
On the 4-hour indicators, ICX got a bullish MACD crossover on October 13th, and the Squeeze Momentum Indicator is showing upward movement. RSI also just crossed into bullish territory as it sits at 51.
Entry: 985-995
Target: 1070-1085.
Stop loss (tight): 970
Stop loss (loose): 925
--This is not financial advice. Always do your own research and come to your own conclusions before buying/investing, as investing in cryptocurrencies comes with high risk and high amounts of volatility .
注释
Ascending triangle did not necessarily pan-out following all the USDT and Bitcoin fiesta. However, we got a nice tweaser bottom reversal and we could posed to move to 1100ish.
免责声明
这些信息和出版物并非旨在提供,也不构成TradingView提供或认可的任何形式的财务、投资、交易或其他类型的建议或推荐。请阅读使用条款了解更多信息。