ICXUSDT Technical Analysis
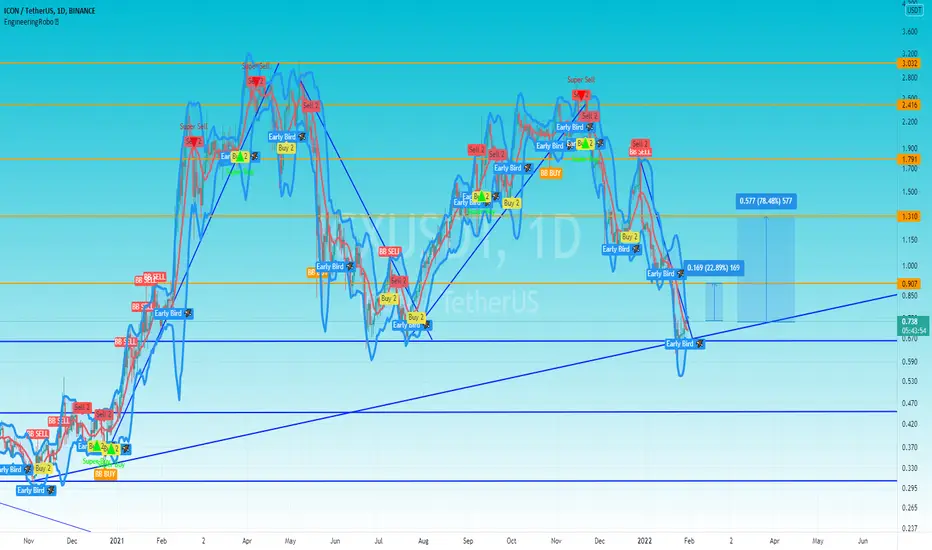
ICON lost over 75% value last November 2021 till now. So, what will happen now? The candles are triangle and candles on down-trendline. There are 2 way at the moment. First of all candle will stay on down trendline and keep going to lose value little bit more or recent candle will close $0.75 and next candle will open-close completely above the down trend-line. Then we will have an opportunity for buy. Also one of the candle open-close completely above the support line as well. MA strategies hasn't gave us signal on daily chart, but when we look at the 3 hours chart, it just changed directions and gave us buy signal. We have got an EARLY BIRD signal from our robo advisor EngineeringRobo couple days ago and if the candles are stay above the middle of the line of Bollinger Bands, it may keep gain more. Our next target might be our resistance line ($0.907). Let's follow our chart closely and don't forget the follow me as well.
"NFA"
"NFA"

免责声明
这些信息和出版物并非旨在提供,也不构成TradingView提供或认可的任何形式的财务、投资、交易或其他类型的建议或推荐。请阅读使用条款了解更多信息。