做多
IDFC BULLISH
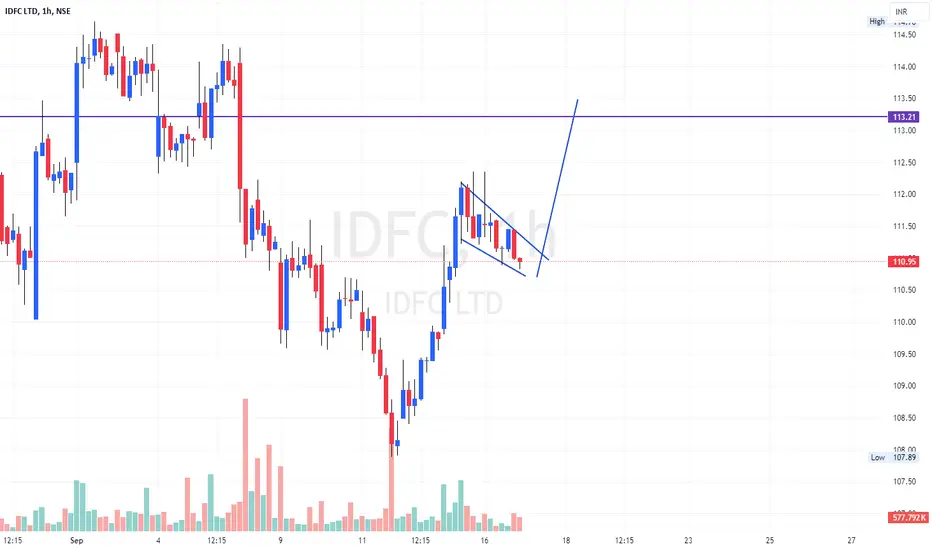
A Bullish Flag is a technical analysis pattern that suggests a potential continuation of a bullish trend. Here's a description of the Bullish Flag pattern in IDFC :
Pattern Description:
Flagpole: The stock price of IDFC has been in a strong uptrend, forming a flagpole (a sharp, almost vertical rise in price).
Consolidation: After the flagpole, the stock price has consolidated within a narrow range, forming a flag (a rectangular or triangular shape).
Upper and Lower Boundaries: The flag has upper and lower boundaries, which are roughly parallel to each other.
Breakout: The stock price is expected to break out above the upper boundary of the flag, continuing the bullish trend.
Pattern Description:
Flagpole: The stock price of IDFC has been in a strong uptrend, forming a flagpole (a sharp, almost vertical rise in price).
Consolidation: After the flagpole, the stock price has consolidated within a narrow range, forming a flag (a rectangular or triangular shape).
Upper and Lower Boundaries: The flag has upper and lower boundaries, which are roughly parallel to each other.
Breakout: The stock price is expected to break out above the upper boundary of the flag, continuing the bullish trend.
注释
SL hit
免责声明
这些信息和出版物并非旨在提供,也不构成TradingView提供或认可的任何形式的财务、投资、交易或其他类型的建议或推荐。请阅读使用条款了解更多信息。
免责声明
这些信息和出版物并非旨在提供,也不构成TradingView提供或认可的任何形式的财务、投资、交易或其他类型的建议或推荐。请阅读使用条款了解更多信息。