
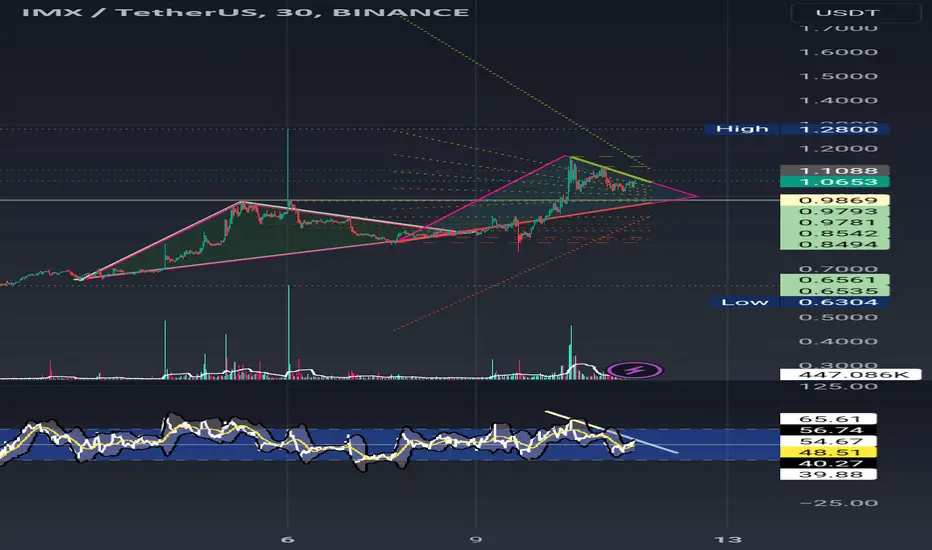
In this 30-minute time chart, we see a nested triangle pattern, which can either go down or up, but it is more likely to go up because One can see the divergence in ( RSI ), which can grow as soon as the trend line breaks. and continue to climb

免责声明
这些信息和出版物并非旨在提供,也不构成TradingView提供或认可的任何形式的财务、投资、交易或其他类型的建议或推荐。请阅读使用条款了解更多信息。