
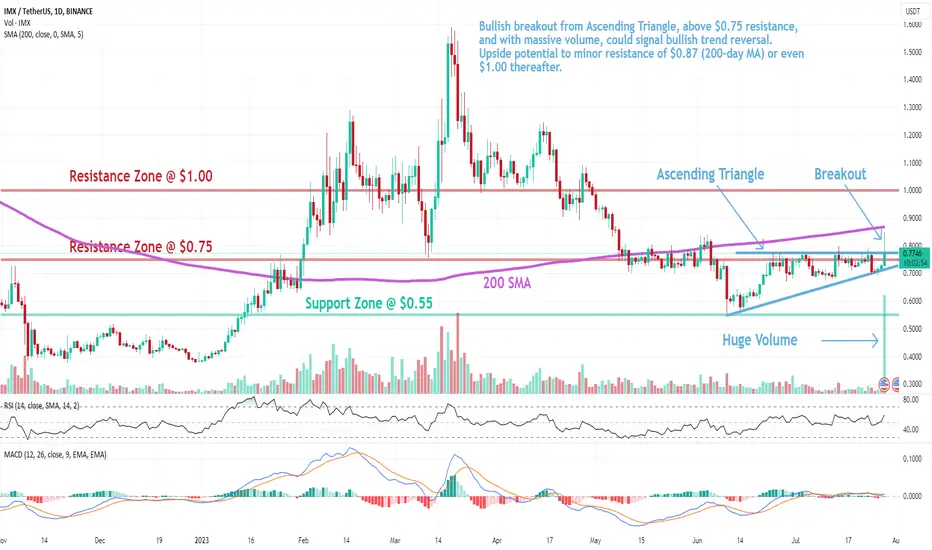
Trade setup: Bullish breakout from Ascending Triangle, above $0.75 resistance, and with massive volume, could signal bullish trend reversal. Upside potential to minor resistance of $0.87 (200-day MA) or even $1.00 thereafter.
Pattern: Ascending Triangle which is a continuation pattern (it typically breaks out in the direction of existing trend). Most traders wait for a breakout but Swing traders could trade between the trendlines (Buy at Support, Sell at Resistance) as long as the trendlines are still relatively far apart.
Trend: Neutral on Medium-Term basis and Downtrend on Short- and Long-Term basis.
Momentum is Bullish (MACD Line is above MACD Signal Line and RSI is above 55).
Support and Resistance: Nearest Support Zone is $0.55. The nearest Resistance Zone is $0.75, which it broke, then $1.00, and $1.30.
Pattern: Ascending Triangle which is a continuation pattern (it typically breaks out in the direction of existing trend). Most traders wait for a breakout but Swing traders could trade between the trendlines (Buy at Support, Sell at Resistance) as long as the trendlines are still relatively far apart.
Trend: Neutral on Medium-Term basis and Downtrend on Short- and Long-Term basis.
Momentum is Bullish (MACD Line is above MACD Signal Line and RSI is above 55).
Support and Resistance: Nearest Support Zone is $0.55. The nearest Resistance Zone is $0.75, which it broke, then $1.00, and $1.30.

免责声明
这些信息和出版物并非旨在提供,也不构成TradingView提供或认可的任何形式的财务、投资、交易或其他类型的建议或推荐。请阅读使用条款了解更多信息。