
Hello Crypto Lovers,
Mars Signals team wishes you high profits.
This is a 4-hour-time frame analysis for IMXUSDT
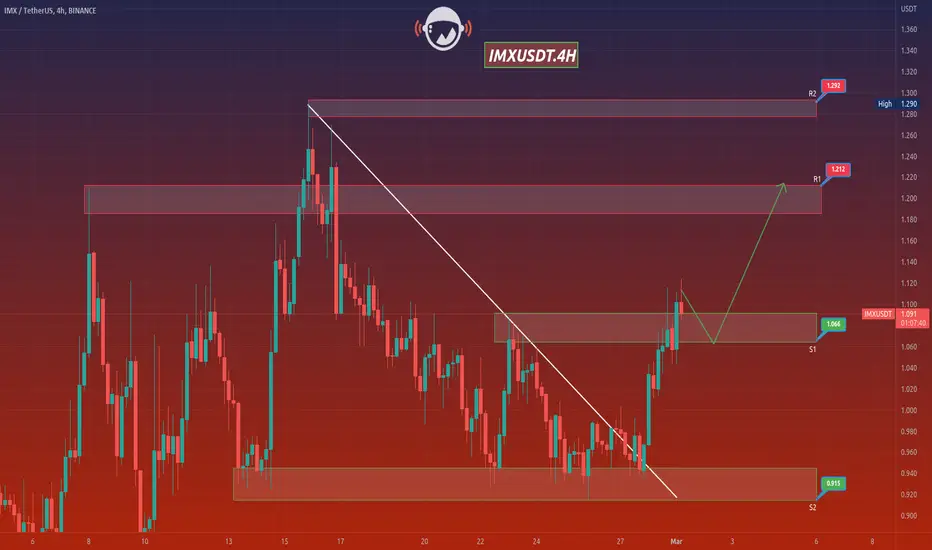
In the current chart, R2 and R1 are the resistance areas which contain the unsuccessful attempts of the price to rise. S1 used to be a resistance line. And S2 is our long-term support area at the bottom expressing the well support of price at several points. Therefore, the price could break S1 upward and we see its fluctuation above this area. The existence of a red candle means the price would have another fall to reach the bottom of S1 and then by providing us some confirmation candles for a rise, there is a possibility of an increase up to R1 and even higher than that. You know that in case the price loses the support at any point and falls below S1 area, surely more decline happens to it. We recommend you to have every piece of information and idea via our analyses for receiving more profitable trades.
Warning: This is just a suggestion and we do not guarantee profits. We advise you to analyze the chart before opening any positions.
Wish you luck
Mars Signals team wishes you high profits.
This is a 4-hour-time frame analysis for IMXUSDT
In the current chart, R2 and R1 are the resistance areas which contain the unsuccessful attempts of the price to rise. S1 used to be a resistance line. And S2 is our long-term support area at the bottom expressing the well support of price at several points. Therefore, the price could break S1 upward and we see its fluctuation above this area. The existence of a red candle means the price would have another fall to reach the bottom of S1 and then by providing us some confirmation candles for a rise, there is a possibility of an increase up to R1 and even higher than that. You know that in case the price loses the support at any point and falls below S1 area, surely more decline happens to it. We recommend you to have every piece of information and idea via our analyses for receiving more profitable trades.
Warning: This is just a suggestion and we do not guarantee profits. We advise you to analyze the chart before opening any positions.
Wish you luck

免责声明
这些信息和出版物并非旨在提供,也不构成TradingView提供或认可的任何形式的财务、投资、交易或其他类型的建议或推荐。请阅读使用条款了解更多信息。
免责声明
这些信息和出版物并非旨在提供,也不构成TradingView提供或认可的任何形式的财务、投资、交易或其他类型的建议或推荐。请阅读使用条款了解更多信息。