
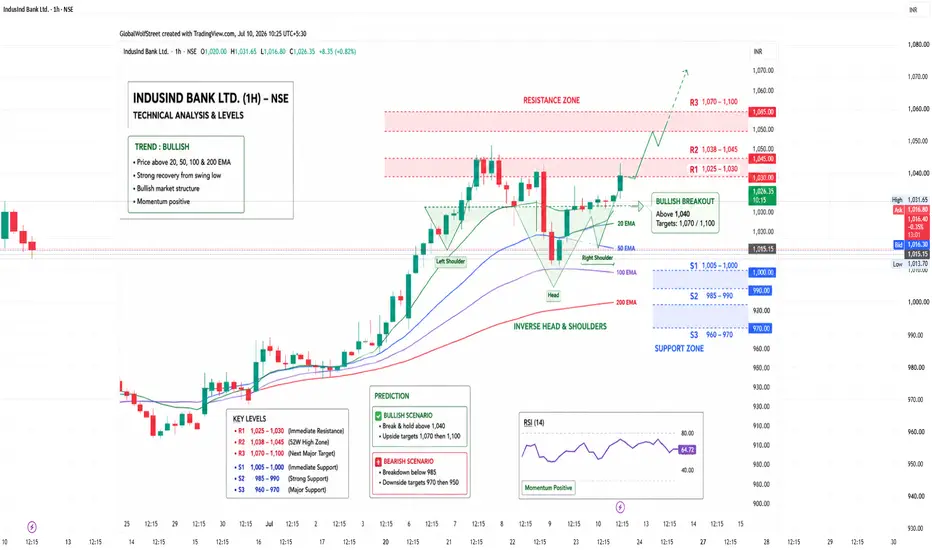
Key Support Levels
₹1,005–1,000 – Immediate support
₹985–990 – Strong swing support
₹960–970 – Major positional support
Key Resistance Levels
₹1,025–1,030 – Immediate resistance
₹1,038–1,045 – 52-week high zone
₹1,070–1,100 – Next positional target if breakout sustains
Technical View
✅ Price is above the 20, 50, 100 and 200-day moving averages, indicating a bullish medium-term trend.
✅ RSI is in the bullish zone (around 65–72), showing strong momentum, though the stock may become overbought if it rallies sharply.
✅ The stock has confirmed an inverse head-and-shoulders breakout, a pattern often associated with trend reversals and continued upside.
Trading Strategy
Bullish scenario
Buy on dips near ₹995–1,005
Breakout above ₹1,040 could lead to ₹1,070 and then ₹1,100
Bearish scenario
A close below ₹985 may trigger profit booking toward ₹960–970
Overall Outlook
Short-term: Bullish
Medium-term: Bullish
Long-term: Positive as long as the stock remains above ₹960–970
If you're looking for an intraday, BTST, or next-week analysis with exact entry, stop-loss, and target levels, let me know your trading style and I can tailor the levels accordingly.
₹1,005–1,000 – Immediate support
₹985–990 – Strong swing support
₹960–970 – Major positional support
Key Resistance Levels
₹1,025–1,030 – Immediate resistance
₹1,038–1,045 – 52-week high zone
₹1,070–1,100 – Next positional target if breakout sustains
Technical View
✅ Price is above the 20, 50, 100 and 200-day moving averages, indicating a bullish medium-term trend.
✅ RSI is in the bullish zone (around 65–72), showing strong momentum, though the stock may become overbought if it rallies sharply.
✅ The stock has confirmed an inverse head-and-shoulders breakout, a pattern often associated with trend reversals and continued upside.
Trading Strategy
Bullish scenario
Buy on dips near ₹995–1,005
Breakout above ₹1,040 could lead to ₹1,070 and then ₹1,100
Bearish scenario
A close below ₹985 may trigger profit booking toward ₹960–970
Overall Outlook
Short-term: Bullish
Medium-term: Bullish
Long-term: Positive as long as the stock remains above ₹960–970
If you're looking for an intraday, BTST, or next-week analysis with exact entry, stop-loss, and target levels, let me know your trading style and I can tailor the levels accordingly.

相关出版物
免责声明
这些信息和出版物并非旨在提供,也不构成TradingView提供或认可的任何形式的财务、投资、交易或其他类型的建议或推荐。请阅读使用条款了解更多信息。