
📍 Latest Price Context
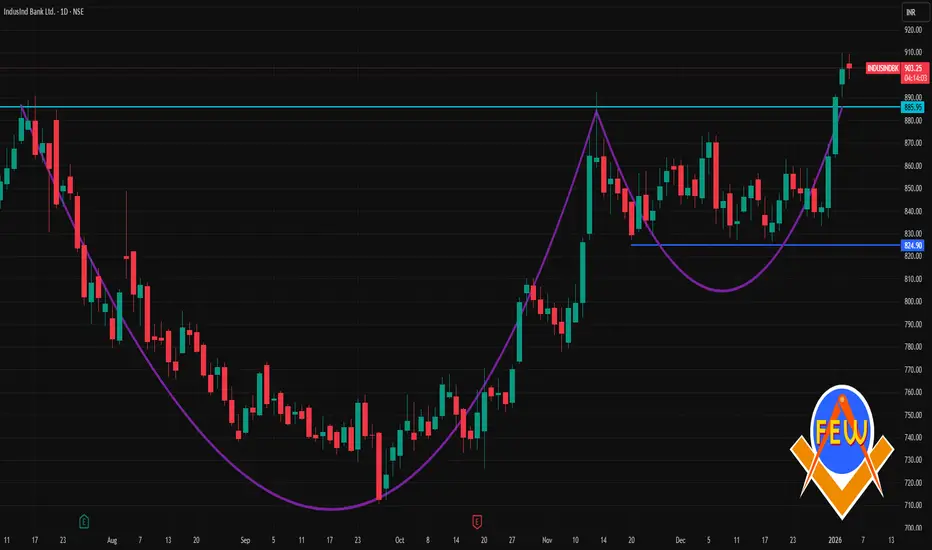
The stock recently closed around ≈ ₹902.45 on the NSE (close of 2 Jan 2026) with intraday range ~₹890‑₹910.
📊 Daily Technical Levels (Support & Resistance)
🔸 Pivot & Major Levels
Level Price (INR)
Pivot Point (Daily) ~₹900.8
Resistance 1 (R1) ~₹911.4
Resistance 2 (R2) ~₹920.3
Resistance 3 (R3) ~₹930.9
Support 1 (S1) ~₹891.9
Support 2 (S2) ~₹881.3
Support 3 (S3) ~₹872.4
📌 Additional Daily Support/Resistance Zones
Near‑term support cluster: ₹842–₹840‑ish (seen on multiple technical sources).
Daily resistance region around: ₹856–₹871 (short swing resistances).
These levels can act as reaction zones if price moves sharply away from pivot — useful if daily volatility increases.
🧠 How to Use These Levels Intraday
👉 Bullish scenario:
Price sustains above the pivot (~₹900.8) → watch for break above R1 (~₹911+) and then R2 (~₹920+).
👉 Bearish scenario:
If price slips below S1 (~₹891.9) → next stops S2 (~₹881.3) and S3 (~₹872.4).
These levels are widely used by day traders for entries, exits & stop placements.
The stock recently closed around ≈ ₹902.45 on the NSE (close of 2 Jan 2026) with intraday range ~₹890‑₹910.
📊 Daily Technical Levels (Support & Resistance)
🔸 Pivot & Major Levels
Level Price (INR)
Pivot Point (Daily) ~₹900.8
Resistance 1 (R1) ~₹911.4
Resistance 2 (R2) ~₹920.3
Resistance 3 (R3) ~₹930.9
Support 1 (S1) ~₹891.9
Support 2 (S2) ~₹881.3
Support 3 (S3) ~₹872.4
📌 Additional Daily Support/Resistance Zones
Near‑term support cluster: ₹842–₹840‑ish (seen on multiple technical sources).
Daily resistance region around: ₹856–₹871 (short swing resistances).
These levels can act as reaction zones if price moves sharply away from pivot — useful if daily volatility increases.
🧠 How to Use These Levels Intraday
👉 Bullish scenario:
Price sustains above the pivot (~₹900.8) → watch for break above R1 (~₹911+) and then R2 (~₹920+).
👉 Bearish scenario:
If price slips below S1 (~₹891.9) → next stops S2 (~₹881.3) and S3 (~₹872.4).
These levels are widely used by day traders for entries, exits & stop placements.

Contact Knowledgehub for a detailed consultation: Dm on WhatsApp: [wa.link/a2o0kz]-
Phone No: [+91 93102 26243]-
Email: [tradingviewknowledgehub@gmail.com]---
-- Let’s achieve success together!
Phone No: [+91 93102 26243]-
Email: [tradingviewknowledgehub@gmail.com]---
-- Let’s achieve success together!
相关出版物
免责声明
这些信息和出版物并非旨在提供,也不构成TradingView提供或认可的任何形式的财务、投资、交易或其他类型的建议或推荐。请阅读使用条款了解更多信息。
Contact Knowledgehub for a detailed consultation: Dm on WhatsApp: [wa.link/a2o0kz]-
Phone No: [+91 93102 26243]-
Email: [tradingviewknowledgehub@gmail.com]---
-- Let’s achieve success together!
Phone No: [+91 93102 26243]-
Email: [tradingviewknowledgehub@gmail.com]---
-- Let’s achieve success together!
相关出版物
免责声明
这些信息和出版物并非旨在提供,也不构成TradingView提供或认可的任何形式的财务、投资、交易或其他类型的建议或推荐。请阅读使用条款了解更多信息。