
📊 Daily Timeframe
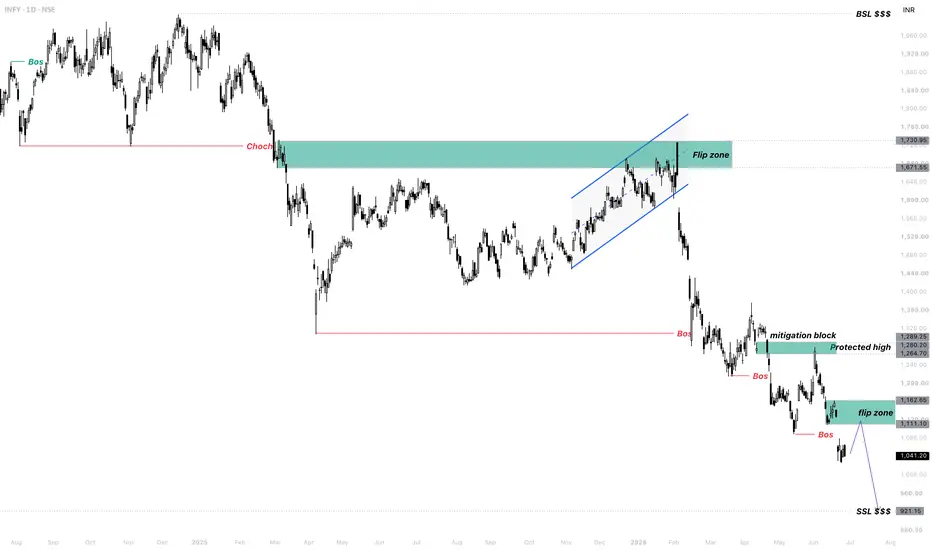
On the Daily, #INFY (Infosys Ltd.) is in a clear downtrend. After printing a CHoCH at ₹1,730.95, price pushed up to correct, tapped into the upper Flip Zone (₹1,671.55 – ₹1,730.95), and then dropped sharply — confirming the bearish shift with a clean BOS.
From there the structure has stayed firmly bearish. Price printed another BOS, pulled back to react from the Mitigation Block / Protected High (₹1,264.70 – ₹1,280.20), and then sold off again with yet another BOS — a textbook stair-step lower, with each corrective bounce getting sold into.
With price now trading around ₹1,041.20, the expectation is for a corrective push back up into the lower Flip Zone (₹1,111.10 – ₹1,162.65) — and from that supply, we look for the rejection that sends price down toward the sell-side liquidity (SSL) resting below at ₹921.15.
⏱️ Entry Approach
The cleaner short is to let price rally into the Flip Zone rather than chasing it lower here. A reaction from that zone — ideally with a lower-timeframe shift back down — offers the higher-quality entry toward the liquidity below, with risk defined above the zone.
🎯 The Game Plan
📰 Fundamental Backdrop
The technical weakness lines up with the broader picture for India's IT space. Infosys is one of the country's largest IT-services names and a heavyweight in both the Nifty and Sensex, with sentiment driven by global tech-spending trends, deal pipelines, and the wider outsourcing cycle. After an extended downtrend, a structural sequence like this one — repeated breaks with each bounce sold — tends to draw fresh attention to the stock, making the current zone a key area to watch as the trend looks to extend lower.
This analysis will be updated as the market evolves.
If this breakdown added value, drop a like 👍 and a comment 💬 to support the work — and share where you see Infosys heading next!
Best Regards, BigBeluga 🐳
On the Daily, #INFY (Infosys Ltd.) is in a clear downtrend. After printing a CHoCH at ₹1,730.95, price pushed up to correct, tapped into the upper Flip Zone (₹1,671.55 – ₹1,730.95), and then dropped sharply — confirming the bearish shift with a clean BOS.
From there the structure has stayed firmly bearish. Price printed another BOS, pulled back to react from the Mitigation Block / Protected High (₹1,264.70 – ₹1,280.20), and then sold off again with yet another BOS — a textbook stair-step lower, with each corrective bounce getting sold into.
With price now trading around ₹1,041.20, the expectation is for a corrective push back up into the lower Flip Zone (₹1,111.10 – ₹1,162.65) — and from that supply, we look for the rejection that sends price down toward the sell-side liquidity (SSL) resting below at ₹921.15.
⏱️ Entry Approach
The cleaner short is to let price rally into the Flip Zone rather than chasing it lower here. A reaction from that zone — ideally with a lower-timeframe shift back down — offers the higher-quality entry toward the liquidity below, with risk defined above the zone.
🎯 The Game Plan
- Daily bias: bearish — CHoCH → repeated BOS, each pullback (upper Flip Zone, then the Mitigation Block) getting sold.
- The path: a corrective bounce up into the lower Flip Zone (₹1,111.10 – ₹1,162.65).
- Target: rejection from that supply down toward the SSL at ₹921.15.
- Invalidation: a strong reclaim and close back above the Flip Zone, breaking the bearish sequence.
📰 Fundamental Backdrop
The technical weakness lines up with the broader picture for India's IT space. Infosys is one of the country's largest IT-services names and a heavyweight in both the Nifty and Sensex, with sentiment driven by global tech-spending trends, deal pipelines, and the wider outsourcing cycle. After an extended downtrend, a structural sequence like this one — repeated breaks with each bounce sold — tends to draw fresh attention to the stock, making the current zone a key area to watch as the trend looks to extend lower.
This analysis will be updated as the market evolves.
If this breakdown added value, drop a like 👍 and a comment 💬 to support the work — and share where you see Infosys heading next!
Best Regards, BigBeluga 🐳

🔵Gain access to our powerful tools : bigbeluga.com/tv
🔵Join our free discord for updates : discord.com/invite/FuW63RKgdc
All scripts & content provided by BigBeluga are for informational & educational purposes only.
🔵Join our free discord for updates : discord.com/invite/FuW63RKgdc
All scripts & content provided by BigBeluga are for informational & educational purposes only.
免责声明
这些信息和出版物并非旨在提供,也不构成TradingView提供或认可的任何形式的财务、投资、交易或其他类型的建议或推荐。请阅读使用条款了解更多信息。
🔵Gain access to our powerful tools : bigbeluga.com/tv
🔵Join our free discord for updates : discord.com/invite/FuW63RKgdc
All scripts & content provided by BigBeluga are for informational & educational purposes only.
🔵Join our free discord for updates : discord.com/invite/FuW63RKgdc
All scripts & content provided by BigBeluga are for informational & educational purposes only.
免责声明
这些信息和出版物并非旨在提供,也不构成TradingView提供或认可的任何形式的财务、投资、交易或其他类型的建议或推荐。请阅读使用条款了解更多信息。