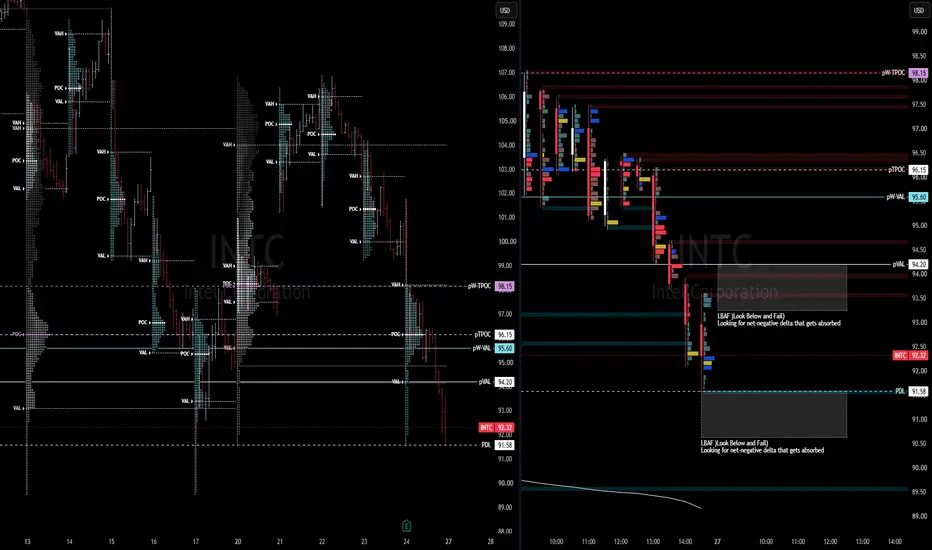
 INTC The week has completed the daily auction with a PM-session sell that closed below its Friday TPO VAL (pVAL) and the current weekly VAL (pW-VAL). This late day initiative lower can reward the seller if they are able to accept and sustain price below Friday's low but also can backfire if the same responsive buying occurs which is in the general area of the low from 2 weeks ago below $90 denoted by the long lower tail it has created.
Using TradingView's volume footprint chart, I have specifically filtered the footprint for delta-only to show net delta aggression per price with a current 10 tick setting on
INTC given its share price, I want to spot two things at PDL or around pVAL (prior RTH Value Area Low); Net-negative delta that fails to reward price lower and gets absorbed by passive buying OR strong net-positive delta that produces a responsive price action at PDL or crossing the pVAL.To clarify the above, this is an AMT approach and requires a different thinking approach at key levels. The basis of using TPOs is to identify areas of value that offer better edge to one side of the market with the whole basis of finding value in one's trade opportunity.
At VAL and below, this is the lower distribution of traded price that can produce two types of market activity; responsive buying or initiative selling. If the auction is not ready to leave a prior day/weekly low, you will see this as failed aggressive selling that produces a reversal followed by strong net-positive delta pushing price back up.
- Strongest delta nodes are in red (sell-aggressive) and blue (buy aggressive)
I lean on the failed aggressive selling at PDL or at the VAL that is followed by net-positive delta nodes at these price points. This is also accompanied by the late-night news headline on the multi-billion dollar deal with Samsun and SK Hynix which should boost the semiconductor sector in general including
INTC - Objectively, would like to see pVAL get reclaimed and complete all the unfinished auctions (shaded lines at tops of footprints) all the way to last week's value control (pW-TPOC) at 98.15s
交易结束:到达止损
The micro gap up on INTC was short lived with weakness in $NQ/ QQQ persisting and causing sellers to drive prices below the VAL and PDL with a lack of responsive buying until the upper 80s.
This created a lower b-shaped auction which requires continuation as this is a profile that is created from forced flows to the downside (longs closing, short aggression).

免责声明
这些信息和出版物并非旨在提供,也不构成TradingView提供或认可的任何形式的财务、投资、交易或其他类型的建议或推荐。请阅读使用条款了解更多信息。