
WEEKLY
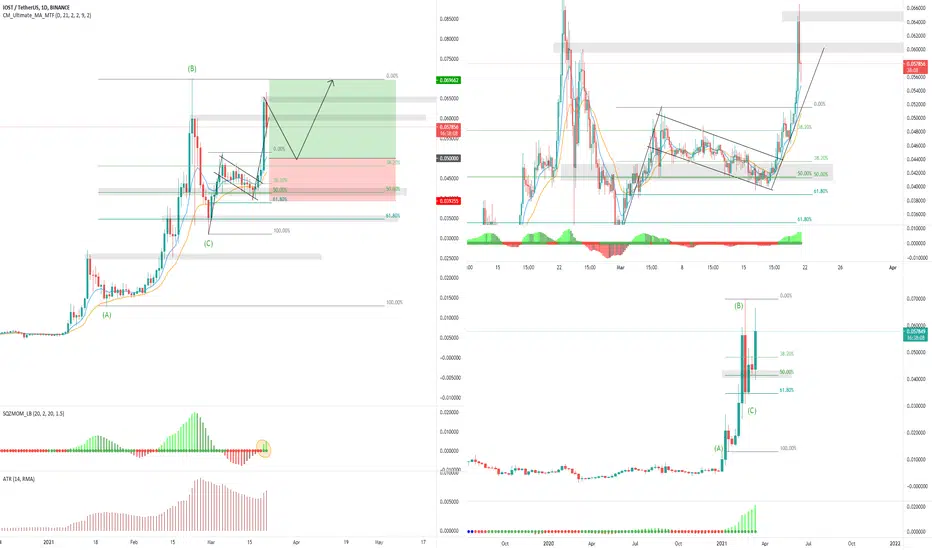
Price currently showing strong weekly bullish momentum since January 11th, after forming a high from the A-B impulse wave, before retracing to the 61.8% fibonacci level.
DAILY
After the weekly retracement to the 61.8% fibonacci levrel price began consolidating and formed a bullish flag pattern which began on the 5th of March until the 18th. Price finally broke resistance of the upper trend line and continue higher above the previous weekly high.
4HR
I have highlights onthe 4HR chart confluence between the weekly retracement and the daily retracement lining up with the 50% fibonacci retracement.
ENTRY
0.050000USDT
S.L
0.039255USDT
T.P
0.069662USDT
R:R
1:1.83
Price currently showing strong weekly bullish momentum since January 11th, after forming a high from the A-B impulse wave, before retracing to the 61.8% fibonacci level.
DAILY
After the weekly retracement to the 61.8% fibonacci levrel price began consolidating and formed a bullish flag pattern which began on the 5th of March until the 18th. Price finally broke resistance of the upper trend line and continue higher above the previous weekly high.
4HR
I have highlights onthe 4HR chart confluence between the weekly retracement and the daily retracement lining up with the 50% fibonacci retracement.
ENTRY
0.050000USDT
S.L
0.039255USDT
T.P
0.069662USDT
R:R
1:1.83

免责声明
这些信息和出版物并非旨在提供,也不构成TradingView提供或认可的任何形式的财务、投资、交易或其他类型的建议或推荐。请阅读使用条款了解更多信息。
免责声明
这些信息和出版物并非旨在提供,也不构成TradingView提供或认可的任何形式的财务、投资、交易或其他类型的建议或推荐。请阅读使用条款了解更多信息。