
Trend Structure
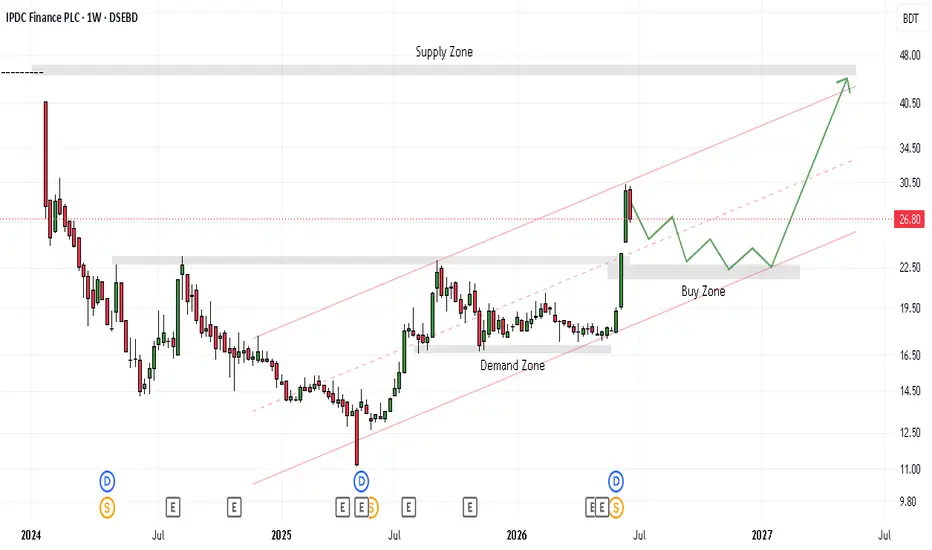
Overall Trend: Strong bullish trend in a well-defined ascending channel (marked by two parallel red trendlines). Price has been systematically making higher highs and higher lows since early 2024.
Channel Midline: The dashed red line running through the center of the channel acts as dynamic support/resistance — the stock has been oscillating around it throughout the uptrend.
Key Zones
Table
Zone Price Range Significance
Demand Zone 17.00 – 19.00 BDT Strong historical buying area; price bounced from here multiple times
Supply Zone 43.00 – 48.00 BDT Target resistance area where sellers have previously stepped in
Current Price 26.80 BDT Positioned in the lower-middle of the channel
Price Action & Projection
Per the Buy Zone (green zigzag) projection:
Near-term: A potential pullback toward the lower channel trendline (around the Demand Zone area) is anticipated. This would shake out weak hands.
Mid-term: After the dip, the projection shows a strong rally toward the Supply Zone (43–48 BDT), which would represent roughly a 60–80% upside from the current price of 26.80.
Key Observations
The stock has been compressing near the channel midline — this tightness often precedes a significant move.
The projected dip aligns with a retest of the lower channel boundary, a classic "re-test and bounce" pattern.
The target supply zone is well ahead of current price, suggesting the analyst sees substantial room to run if the channel holds.
Overall Trend: Strong bullish trend in a well-defined ascending channel (marked by two parallel red trendlines). Price has been systematically making higher highs and higher lows since early 2024.
Channel Midline: The dashed red line running through the center of the channel acts as dynamic support/resistance — the stock has been oscillating around it throughout the uptrend.
Key Zones
Table
Zone Price Range Significance
Demand Zone 17.00 – 19.00 BDT Strong historical buying area; price bounced from here multiple times
Supply Zone 43.00 – 48.00 BDT Target resistance area where sellers have previously stepped in
Current Price 26.80 BDT Positioned in the lower-middle of the channel
Price Action & Projection
Per the Buy Zone (green zigzag) projection:
Near-term: A potential pullback toward the lower channel trendline (around the Demand Zone area) is anticipated. This would shake out weak hands.
Mid-term: After the dip, the projection shows a strong rally toward the Supply Zone (43–48 BDT), which would represent roughly a 60–80% upside from the current price of 26.80.
Key Observations
The stock has been compressing near the channel midline — this tightness often precedes a significant move.
The projected dip aligns with a retest of the lower channel boundary, a classic "re-test and bounce" pattern.
The target supply zone is well ahead of current price, suggesting the analyst sees substantial room to run if the channel holds.

免责声明
这些信息和出版物并非旨在提供,也不构成TradingView提供或认可的任何形式的财务、投资、交易或其他类型的建议或推荐。请阅读使用条款了解更多信息。