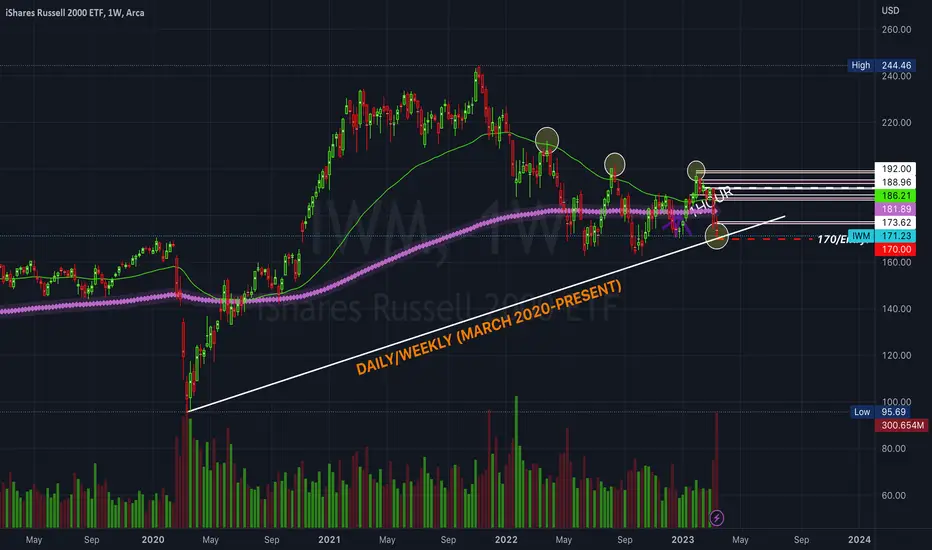
 IWM50 MA crossed down the 200 MA on the daily and 4H timeframe. The daily chart shows a lot of sellers. IWM also made lower highs on the weekly timeframe. Also, the exchange traded fund is resting on a trendline that it's maintained since March 2020! If we break down below 170 and it holds, IWM should see more downside. The weekly chart shows an increase of sellers between last week and this week. Last but not least, the etf shows a shooting star candle that printed on the weekly chart (March 13-17, 2023). Therefore, my plan is to short IWM below 170!
I will ride down IWM 170 (provided price gets there of course).
*This is not financial advice
Peace & Harmony,
MrALtrades00
注释
IWM also has a head and shoulders pattern on the daily timeframe! 
免责声明
这些信息和出版物并非旨在提供,也不构成TradingView提供或认可的任何形式的财务、投资、交易或其他类型的建议或推荐。请阅读使用条款了解更多信息。
免责声明
这些信息和出版物并非旨在提供,也不构成TradingView提供或认可的任何形式的财务、投资、交易或其他类型的建议或推荐。请阅读使用条款了解更多信息。