
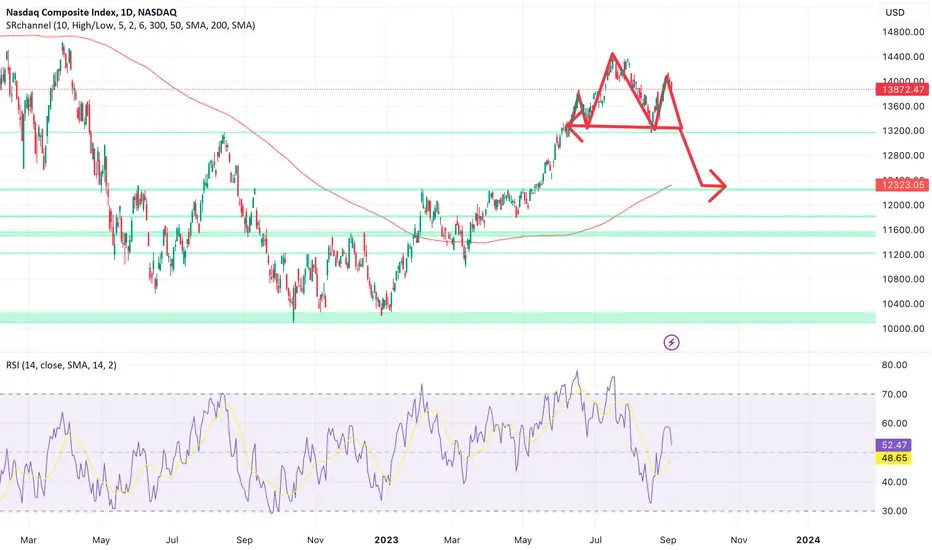
NASDAQ is forming a potential head and shoulder pattern
The neck line of this shoulder is 13247
If it goes below that or the daily candle close below that level that means the bearish trend will start
Looking @ DXY also it seems it is coinciding as usual with the potential down turn of the market .
20 Sept is the Fed event and that can bring the news to push the market down
The strong support level is 12289 level
Anything around 12k area should be a strong buy as the bound from this level would be amazing,
The neck line of this shoulder is 13247
If it goes below that or the daily candle close below that level that means the bearish trend will start
Looking @ DXY also it seems it is coinciding as usual with the potential down turn of the market .
20 Sept is the Fed event and that can bring the news to push the market down
The strong support level is 12289 level
Anything around 12k area should be a strong buy as the bound from this level would be amazing,
注释
So it has indeed crossed the neck line and looks like we are going to go back to 12800 or 12300 levels . Great shopping time coming ahead
免责声明
这些信息和出版物并非旨在提供,也不构成TradingView提供或认可的任何形式的财务、投资、交易或其他类型的建议或推荐。请阅读使用条款了解更多信息。
免责声明
这些信息和出版物并非旨在提供,也不构成TradingView提供或认可的任何形式的财务、投资、交易或其他类型的建议或推荐。请阅读使用条款了解更多信息。