
This is my favorite analysis
I give my qualified bid here on how NASDAQ and the market are going to evolve.
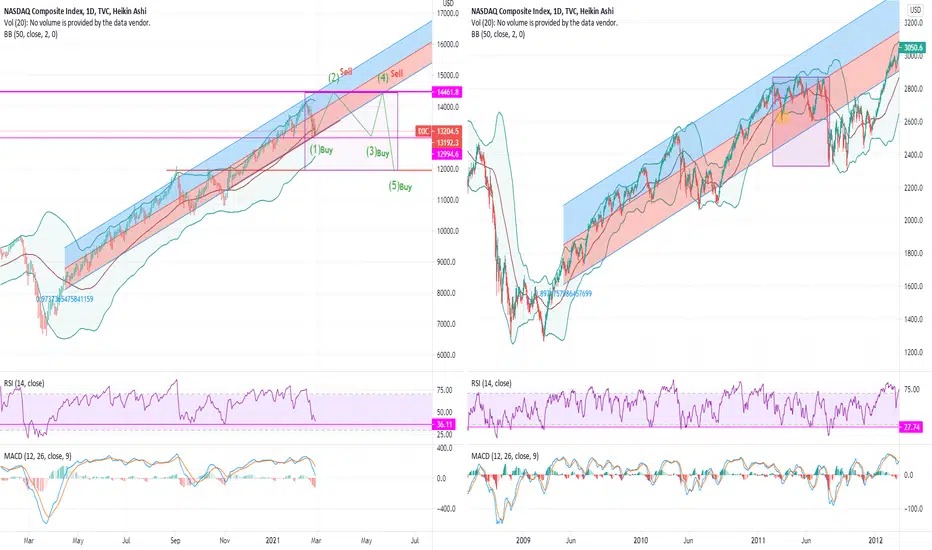
the graph is very similar to the financial crisis and makes exactly the same pattern, on top, bottom, RSI and MACD.
10-y bond have fallen and as I wrote in my other analysis, bonds will return to 0.95 and up again to 1.5. it's making a cup and handle now.
Follow the dates on the 1,2,3,4,5 wave and compare it with 10-y bond, and financial crisis(15. march 2011 to 17. june 2011).
I give my qualified bid here on how NASDAQ and the market are going to evolve.
the graph is very similar to the financial crisis and makes exactly the same pattern, on top, bottom, RSI and MACD.
10-y bond have fallen and as I wrote in my other analysis, bonds will return to 0.95 and up again to 1.5. it's making a cup and handle now.
Follow the dates on the 1,2,3,4,5 wave and compare it with 10-y bond, and financial crisis(15. march 2011 to 17. june 2011).

免责声明
这些信息和出版物并非旨在提供,也不构成TradingView提供或认可的任何形式的财务、投资、交易或其他类型的建议或推荐。请阅读使用条款了解更多信息。