
What Is the Nasdaq Composite Index?
The Nasdaq Composite Index is a large market-cap-weighted index of more than 2,500 stocks, American depositary receipts (ADRs), and real estate investment trusts (REITs), among others.
The index is calculated constantly throughout the trading day with the final value reported at 4:16 p.m. daily once prices have fully settled after the 4:00 p.m. ET market close.
The Index's composition is nearly 50% technology, with consumer services, health care, and financials the next most prominent industries.(1)
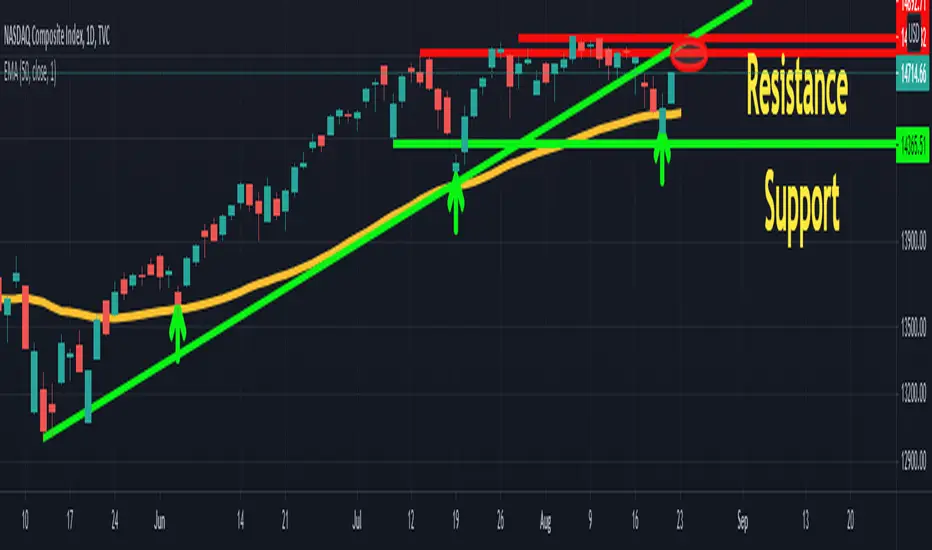
Resistance level: 14836-14895

Support:14417

Trend: Broke below the bullish trend line after 66 days!
Hourly Chart: Descending Broadening Wedge pattern:

Where the wedge shows a stronger bearish tendency there’s a significantly higher probability that the market will continue to trend downwards for some time as the wedge grows. So before trading the pattern it’s a good idea to use some pointers to try to gauge the market sentiment and which way the trend is likely to unfold. (2)
Weekly Chart:
Tendenci to correct 3 weeks in a row:


Conclusion: pullback to trend line is very likely, waiting for the reaction is the best choice in my opinion.
Moshkelgosha
Reference Article:
1-https://www.investopedia.com/terms/n/nasdaqcompositeindex.asp
2-https://forexop.com/technical/descending-broadening-wedge/
The Nasdaq Composite Index is a large market-cap-weighted index of more than 2,500 stocks, American depositary receipts (ADRs), and real estate investment trusts (REITs), among others.
The index is calculated constantly throughout the trading day with the final value reported at 4:16 p.m. daily once prices have fully settled after the 4:00 p.m. ET market close.
The Index's composition is nearly 50% technology, with consumer services, health care, and financials the next most prominent industries.(1)
Resistance level: 14836-14895
Support:14417
Trend: Broke below the bullish trend line after 66 days!
Hourly Chart: Descending Broadening Wedge pattern:
Where the wedge shows a stronger bearish tendency there’s a significantly higher probability that the market will continue to trend downwards for some time as the wedge grows. So before trading the pattern it’s a good idea to use some pointers to try to gauge the market sentiment and which way the trend is likely to unfold. (2)
Weekly Chart:
Tendenci to correct 3 weeks in a row:
Conclusion: pullback to trend line is very likely, waiting for the reaction is the best choice in my opinion.
Moshkelgosha
Reference Article:
1-https://www.investopedia.com/terms/n/nasdaqcompositeindex.asp
2-https://forexop.com/technical/descending-broadening-wedge/

Use the following link to access trading ideas: patreon.com/SniperTraderStocks?utm_medium=unknown&utm_source=join_link&utm_campaign=creatorshare_creator&utm_content=copyLink
免责声明
这些信息和出版物并非旨在提供,也不构成TradingView提供或认可的任何形式的财务、投资、交易或其他类型的建议或推荐。请阅读使用条款了解更多信息。
Use the following link to access trading ideas: patreon.com/SniperTraderStocks?utm_medium=unknown&utm_source=join_link&utm_campaign=creatorshare_creator&utm_content=copyLink
免责声明
这些信息和出版物并非旨在提供,也不构成TradingView提供或认可的任何形式的财务、投资、交易或其他类型的建议或推荐。请阅读使用条款了解更多信息。