
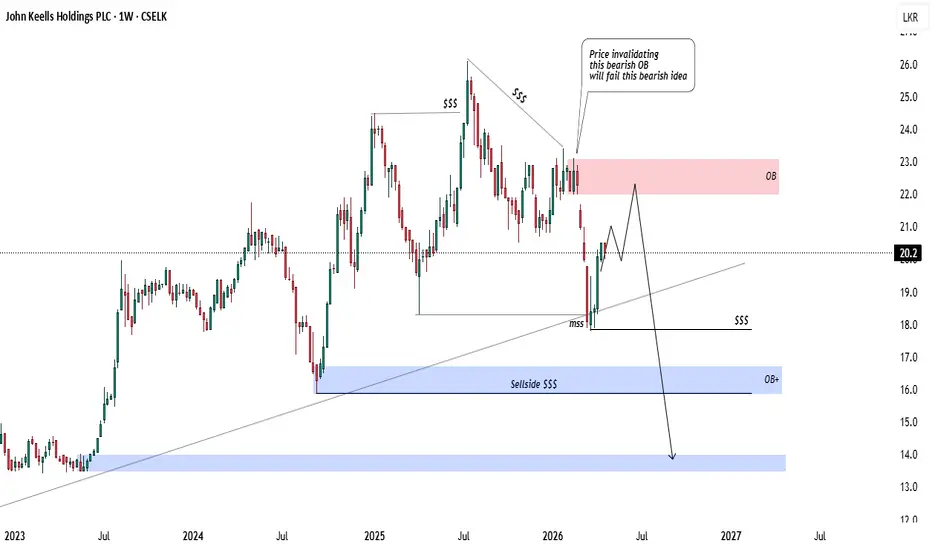
The weekly chart for John Keells Holdings PLC (JKH) reveals a bearish structural shift after the price failed to maintain its long-term bullish momentum, signaling a deeper correction toward historical liquidity zones.
Key Observations
Bearish Order Block (OB): The price faced significant resistance within the red shaded zone (22.0–23.0). This area acts as a bearish supply zone; as noted, price invalidating this OB would fail the bearish thesis, but the recent rejection confirms seller dominance.
Market Structure Shift (MSS): A critical MSS occurred near the 18.5 level, where the price broke below previous swing lows. This break of structure suggests that the long-term trend has shifted from "buy the dips" to "sell the rallies."
Liquidity Gaps & Targets: The chart identifies Sellside Liquidity ($$$) sitting around the 16.0 level. Below that, a significant OB+ zone (blue shaded area) near 14.0 remains the primary magnet for price action if the current bearish trajectory continues.
Projected Path: The expected movement involves a corrective bounce (retest of the breakdown level) before a sustained decline toward the lower liquidity pools.
Summary
The outlook for JKH is decidedly bearish following the confirmation of the bearish Order Block and the subsequent Market Structure Shift. The trendline that supported the 2023–2025 rally has been breached, and the price is now navigating a "retest and drop" sequence. While short-term volatility might see a minor move toward 21.0, the technical weight points toward a liquidation event targeting the 16.0 and 14.0 support zones. Traders should monitor the 23.0 level for invalidation of this bearish outlook.
Key Observations
Bearish Order Block (OB): The price faced significant resistance within the red shaded zone (22.0–23.0). This area acts as a bearish supply zone; as noted, price invalidating this OB would fail the bearish thesis, but the recent rejection confirms seller dominance.
Market Structure Shift (MSS): A critical MSS occurred near the 18.5 level, where the price broke below previous swing lows. This break of structure suggests that the long-term trend has shifted from "buy the dips" to "sell the rallies."
Liquidity Gaps & Targets: The chart identifies Sellside Liquidity ($$$) sitting around the 16.0 level. Below that, a significant OB+ zone (blue shaded area) near 14.0 remains the primary magnet for price action if the current bearish trajectory continues.
Projected Path: The expected movement involves a corrective bounce (retest of the breakdown level) before a sustained decline toward the lower liquidity pools.
Summary
The outlook for JKH is decidedly bearish following the confirmation of the bearish Order Block and the subsequent Market Structure Shift. The trendline that supported the 2023–2025 rally has been breached, and the price is now navigating a "retest and drop" sequence. While short-term volatility might see a minor move toward 21.0, the technical weight points toward a liquidation event targeting the 16.0 and 14.0 support zones. Traders should monitor the 23.0 level for invalidation of this bearish outlook.

免责声明
这些信息和出版物并非旨在提供,也不构成TradingView提供或认可的任何形式的财务、投资、交易或其他类型的建议或推荐。请阅读使用条款了解更多信息。