
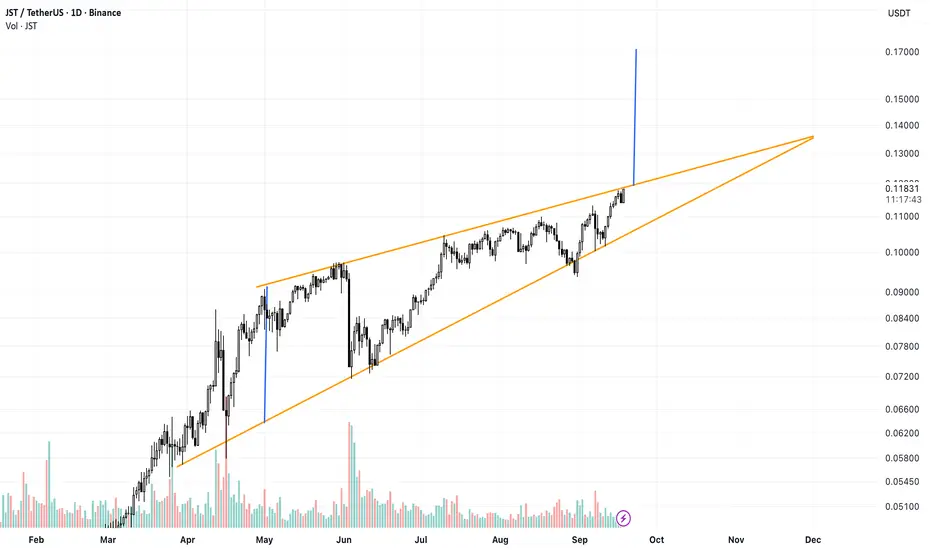
JST/USDT is trading inside a large rising wedge on the 1D chart, with price forming higher highs and higher lows while both trendlines gradually converge. Price is now testing the upper boundary around $0.118–$0.120 after another strong push from the lower support.
A confirmed daily breakout and hold above the upper trendline could trigger a bullish expansion toward the $0.165–$0.170 target area. However, because a rising wedge is traditionally a bearish structure, a rejection from the upper boundary followed by a breakdown below the rising support would weaken the bullish scenario and increase the probability of a deeper correction.
A confirmed daily breakout and hold above the upper trendline could trigger a bullish expansion toward the $0.165–$0.170 target area. However, because a rising wedge is traditionally a bearish structure, a rejection from the upper boundary followed by a breakdown below the rising support would weaken the bullish scenario and increase the probability of a deeper correction.

免责声明
这些信息和出版物并非旨在提供,也不构成TradingView提供或认可的任何形式的财务、投资、交易或其他类型的建议或推荐。请阅读使用条款了解更多信息。