
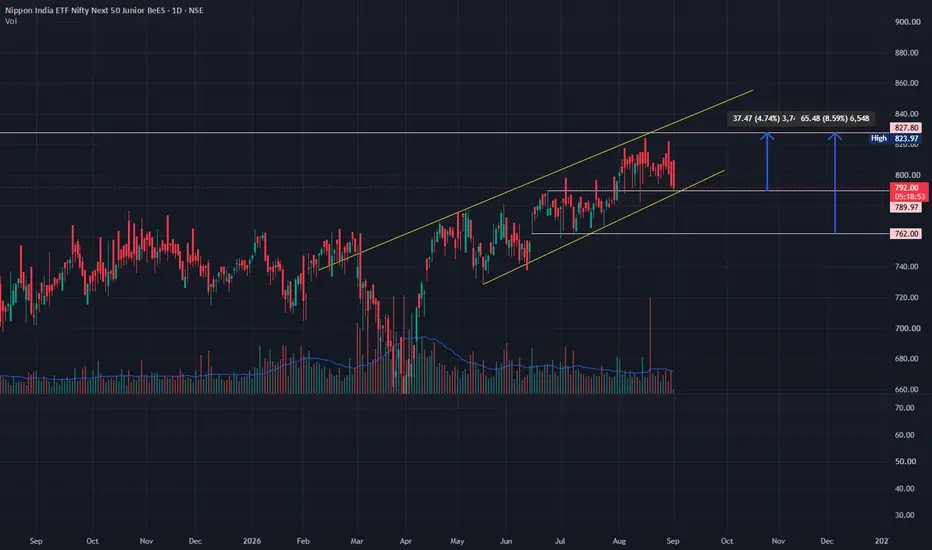
Based on the daily chart for Nippon India ETF Nifty Next 50 Junior BeES (JUNIORBEES), here is the technical breakdown and short-term levels:
Trend & Structure
Lower Boundary Test: The price is currently resting right on the lower boundary line of the ascending channel around 789.97 – 790.81.
Pullback from Highs: Following a swing high near 823.97 (High label), the ETF has pulled back over recent daily sessions to retest the trendline support.
Volume Profile: Volume levels remain moderate to low on this pullback, indicating a orderly correction rather than aggressive institutional selling.
Key Technical Levels
Immediate Resistance (Upside Target 1): 823.97 – 827.80 (Recent swing high resistance area, ~4.74% potential upside from channel support)
Upper Channel Target (Upside Target 2): 845.00 – 855.00 (Upper yellow trendline projection)
Immediate Support: 789.97 (Current lower channel trendline support level)
Major Support (Downside Target): 762.00 (Prior horizontal base consolidation low from July; target if trendline breaks)
Short-Term Scenarios
Bullish Rebound (Primary Setup): Holding above 789.97 supports a bounce back toward 823.97 (+4.7%), with extended momentum targeting the upper channel boundary (~850.00).
Bearish Breakdown (Risk Management): A daily close below 789.00 invalidates the current ascending channel, opening up downside risk toward the horizontal demand zone at 762.00 (~8.5% drop from the high).
Disclaimer - All information on this page is for educational purposes only,
we are not SEBI Registered, Please consult a SEBI registered financial advisor for your financial matters before investing And taking any decision. We are not responsible for any profit/loss you made.
Request your support and engagement by liking and commenting & follow to provide encouragement
HAPPY TRADING 👍
Trend & Structure
Lower Boundary Test: The price is currently resting right on the lower boundary line of the ascending channel around 789.97 – 790.81.
Pullback from Highs: Following a swing high near 823.97 (High label), the ETF has pulled back over recent daily sessions to retest the trendline support.
Volume Profile: Volume levels remain moderate to low on this pullback, indicating a orderly correction rather than aggressive institutional selling.
Key Technical Levels
Immediate Resistance (Upside Target 1): 823.97 – 827.80 (Recent swing high resistance area, ~4.74% potential upside from channel support)
Upper Channel Target (Upside Target 2): 845.00 – 855.00 (Upper yellow trendline projection)
Immediate Support: 789.97 (Current lower channel trendline support level)
Major Support (Downside Target): 762.00 (Prior horizontal base consolidation low from July; target if trendline breaks)
Short-Term Scenarios
Bullish Rebound (Primary Setup): Holding above 789.97 supports a bounce back toward 823.97 (+4.7%), with extended momentum targeting the upper channel boundary (~850.00).
Bearish Breakdown (Risk Management): A daily close below 789.00 invalidates the current ascending channel, opening up downside risk toward the horizontal demand zone at 762.00 (~8.5% drop from the high).
Disclaimer - All information on this page is for educational purposes only,
we are not SEBI Registered, Please consult a SEBI registered financial advisor for your financial matters before investing And taking any decision. We are not responsible for any profit/loss you made.
Request your support and engagement by liking and commenting & follow to provide encouragement
HAPPY TRADING 👍

免责声明
这些信息和出版物并非旨在提供,也不构成TradingView提供或认可的任何形式的财务、投资、交易或其他类型的建议或推荐。请阅读使用条款了解更多信息。