
JUSTDIAL [for swing trading ]
Price Pattern:
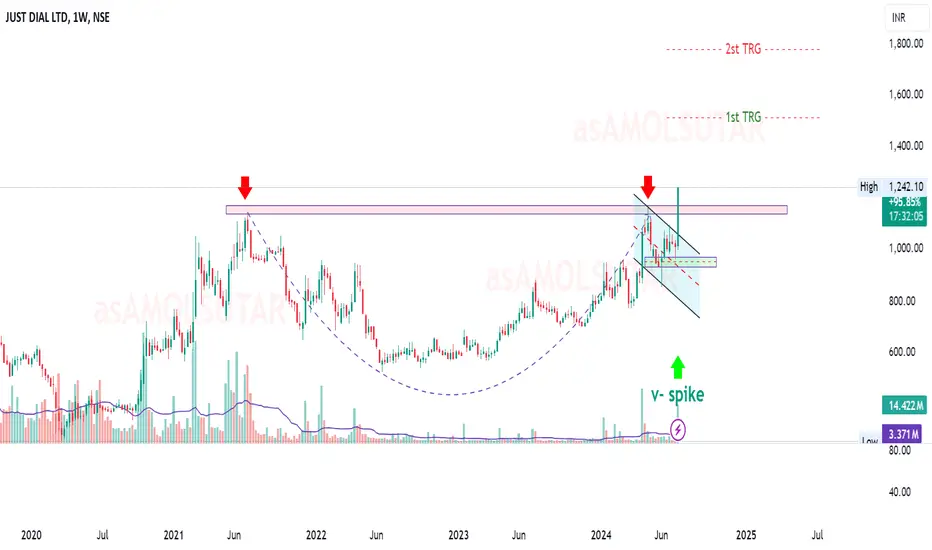
There is a cup and handle pattern forming, with the cup's bottom forming around the 2022-2023 period and the handle forming recently.
The breakout from the handle is a positive sign and could lead to a strong upward move if it holds above the resistance.
Trend Channel:
The descending channel (handle part of the cup and handle) is shown, and the recent breakout from this channel is a bullish signal.
Targets (TRG):
The chart shows two target levels: the first target (1st TRG) around 1400 and the second target (2st TRG) around 1800. These levels can be considered as potential profit-taking points.
Volume Spike:
The green arrow indicating a volume spike suggests increased buying interest. This can be a sign of accumulation, which is bullish.
Entry Point:
A good entry point would be on a pullback to the breakout level, around 1200-1250, which is now a support zone.
Stop Loss:
Place a stop loss below the support zone, around 1150-1180, to limit potential losses if the breakout fails.
First Target (1st TRG):
Aim for the first target around 1400, as indicated on the chart. This level is likely to encounter some resistance.
Second Target (2st TRG):
If the price momentum continues, the second target around 1800 can be considered for additional profits.
Volume Confirmation:
News :-
in.tradingview.com/news/reuters.com,2024:newsml_L4N3JA0K1:0-india-s-just-dial-jumps-to-9-year-high-after-upbeat-q1-results/
for MORE check in my Tv-id " in.tradingview.com/u/asAMOLSUTAR/ "
If You LIKE👌👌 MY Idea ......Boost.🔥🔥🔥.. its.

"Disclosure : I am not Sebi-registered." This channel is for only educational purpose. Any profit/loss, I am not responsible.
Before taking any trade on our charts / calls, please consult your financial advisors. Thanks
This stock Multi-year breakout with high volume spike today getting last movement upper circuit so .. buyer are very aggressive looking .
Price Pattern:
There is a cup and handle pattern forming, with the cup's bottom forming around the 2022-2023 period and the handle forming recently.
The breakout from the handle is a positive sign and could lead to a strong upward move if it holds above the resistance.
Trend Channel:
The descending channel (handle part of the cup and handle) is shown, and the recent breakout from this channel is a bullish signal.
Targets (TRG):
The chart shows two target levels: the first target (1st TRG) around 1400 and the second target (2st TRG) around 1800. These levels can be considered as potential profit-taking points.
Volume Spike:
The green arrow indicating a volume spike suggests increased buying interest. This can be a sign of accumulation, which is bullish.
Swing Trading Points
Entry Point:
A good entry point would be on a pullback to the breakout level, around 1200-1250, which is now a support zone.
Stop Loss:
Place a stop loss below the support zone, around 1150-1180, to limit potential losses if the breakout fails.
First Target (1st TRG):
Aim for the first target around 1400, as indicated on the chart. This level is likely to encounter some resistance.
Second Target (2st TRG):
If the price momentum continues, the second target around 1800 can be considered for additional profits.
Volume Confirmation:
Keep an eye on the volume. A continued increase in volume on upward moves will confirm the strength of the trend.
News :-
in.tradingview.com/news/reuters.com,2024:newsml_L4N3JA0K1:0-india-s-just-dial-jumps-to-9-year-high-after-upbeat-q1-results/
for MORE check in my Tv-id " in.tradingview.com/u/asAMOLSUTAR/ "
If You LIKE👌👌 MY Idea ......Boost.🔥🔥🔥.. its.
"Disclosure : I am not Sebi-registered." This channel is for only educational purpose. Any profit/loss, I am not responsible.
Before taking any trade on our charts / calls, please consult your financial advisors. Thanks

免责声明
这些信息和出版物并非旨在提供,也不构成TradingView提供或认可的任何形式的财务、投资、交易或其他类型的建议或推荐。请阅读使用条款了解更多信息。
免责声明
这些信息和出版物并非旨在提供,也不构成TradingView提供或认可的任何形式的财务、投资、交易或其他类型的建议或推荐。请阅读使用条款了解更多信息。