An Uptrend Pattern!
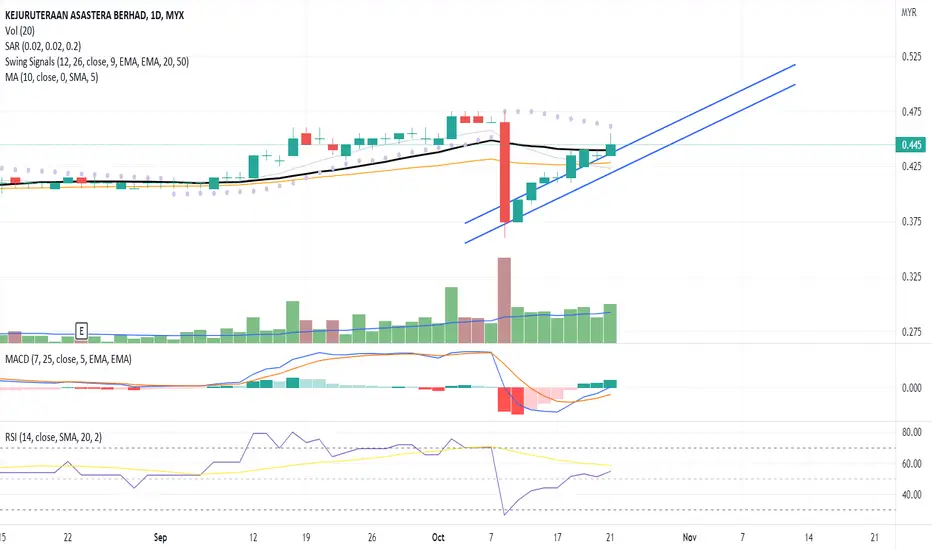
The candlestick pattern indicates a continuous price uptrend towards the MA20 line backed with high volume.
Precaution because the last candlestick indicates a "shooting star" candle, hence, the probability of price correction between the trendline channel or potential resistance area around the price range of the candle.
The MACD confirms the price uptrend towards the next price resistance.
The RSI indicates a fresh buying interest in the stock.
Let's put KAB in WL and watch out for continuous price movement toward the next price resistance backed with volume.
R 0.470
S 0.425
Precaution because the last candlestick indicates a "shooting star" candle, hence, the probability of price correction between the trendline channel or potential resistance area around the price range of the candle.
The MACD confirms the price uptrend towards the next price resistance.
The RSI indicates a fresh buying interest in the stock.
Let's put KAB in WL and watch out for continuous price movement toward the next price resistance backed with volume.
R 0.470
S 0.425

免责声明
这些信息和出版物并非旨在提供,也不构成TradingView提供或认可的任何形式的财务、投资、交易或其他类型的建议或推荐。请阅读使用条款了解更多信息。
免责声明
这些信息和出版物并非旨在提供,也不构成TradingView提供或认可的任何形式的财务、投资、交易或其他类型的建议或推荐。请阅读使用条款了解更多信息。