
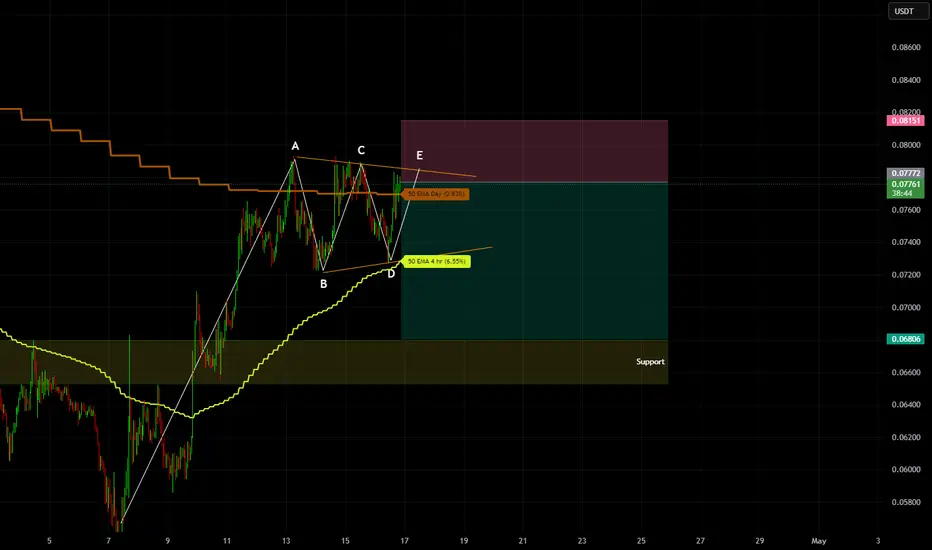
Looks like KASUSDT is wrapping up an ABCDE reversal pattern right on the daily 50EMA — point E seems to be the final touch.
What stands out is how that 50EMA is acting like a brick wall — price got rejected at A, C, and now again at E.
My target’s the support zone marked on the chart.
I’m not setting a tight stop — too easy to get wicked out by some stop-hunting move.
I’ll only cut the trade if we get multiple candle bodies closing clean above the daily 50EMA.
交易手动结束
Closing the trade at current price with profit.
免责声明
这些信息和出版物并非旨在提供,也不构成TradingView提供或认可的任何形式的财务、投资、交易或其他类型的建议或推荐。请阅读使用条款了解更多信息。