
Kava (KAVA) technical analysis:
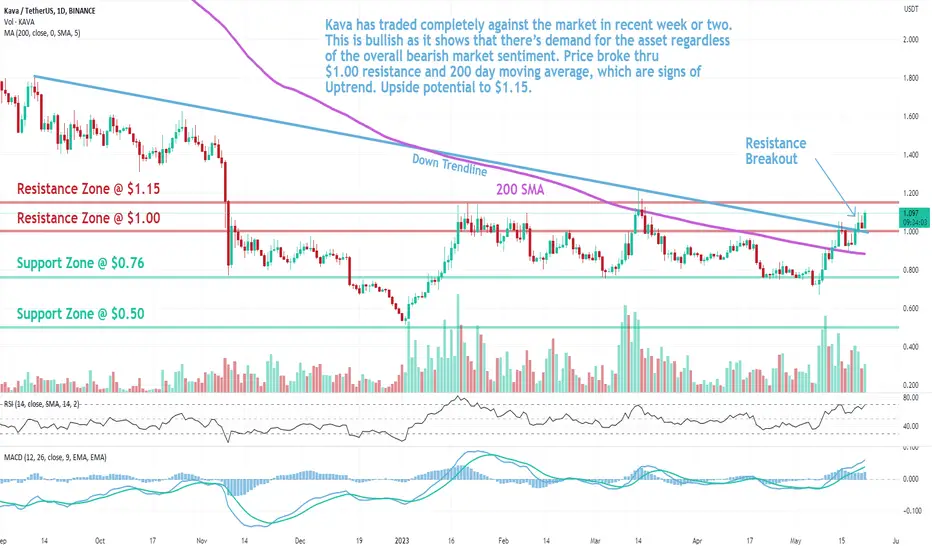
Trade setup: Kava has traded completely against the market in recent week or two. This is bullish as it shows that there’s demand for the asset regardless of the overall bearish market sentiment. Price broke thru $1.00 resistance and 200 day moving average, which are signs of Uptrend. Upside potential to $1.15.
Trend: Uptrend on Short- and Medium-Term basis and Downtrend on Long-Term basis.
Momentum is Bullish (MACD Line is above MACD Signal Line and RSI is above 55).
Support and Resistance: Nearest Support Zone is $0.76, then $0.50. The nearest Resistance Zone is $1.00, which it broke, then $1.15, and $1.40.
Trade setup: Kava has traded completely against the market in recent week or two. This is bullish as it shows that there’s demand for the asset regardless of the overall bearish market sentiment. Price broke thru $1.00 resistance and 200 day moving average, which are signs of Uptrend. Upside potential to $1.15.
Trend: Uptrend on Short- and Medium-Term basis and Downtrend on Long-Term basis.
Momentum is Bullish (MACD Line is above MACD Signal Line and RSI is above 55).
Support and Resistance: Nearest Support Zone is $0.76, then $0.50. The nearest Resistance Zone is $1.00, which it broke, then $1.15, and $1.40.

免责声明
这些信息和出版物并非旨在提供,也不构成TradingView提供或认可的任何形式的财务、投资、交易或其他类型的建议或推荐。请阅读使用条款了解更多信息。