Coffee under pressure
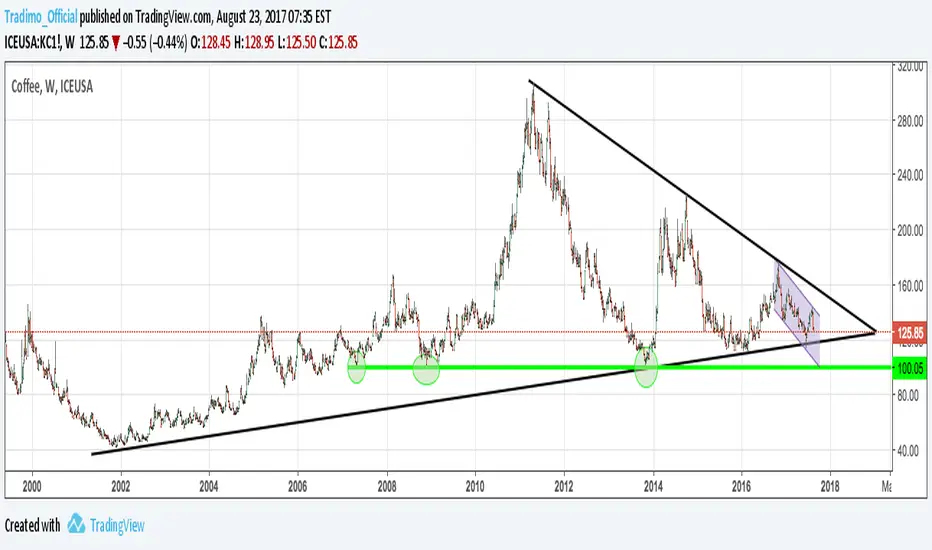
The chart shows coffee in a weekly chart over a very long period of time. At the very least, you can see very clearly how important it is to draw support and resistances and trend lines. You can clearly see the trend line that has already been successfully tested more than 3 times. However, there is also an opposite trend line which limits the coffee price into an increasingly narrowing price zone. This means that this triangle must always be broken and this usually takes a strong momentum and a lot of dynamics.
The chart also provides horizontal support for the important psychological level of 100, which has also been successfully tested several times. What can still be seen on the chart is a trend channel, which plays an important role in the daily chart.
In our opinion, it is worth a weekly view of the coffee cart, in order not to miss the breakout.

免责声明
这些信息和出版物并非旨在提供,也不构成TradingView提供或认可的任何形式的财务、投资、交易或其他类型的建议或推荐。请阅读使用条款了解更多信息。
免责声明
这些信息和出版物并非旨在提供,也不构成TradingView提供或认可的任何形式的财务、投资、交易或其他类型的建议或推荐。请阅读使用条款了解更多信息。