
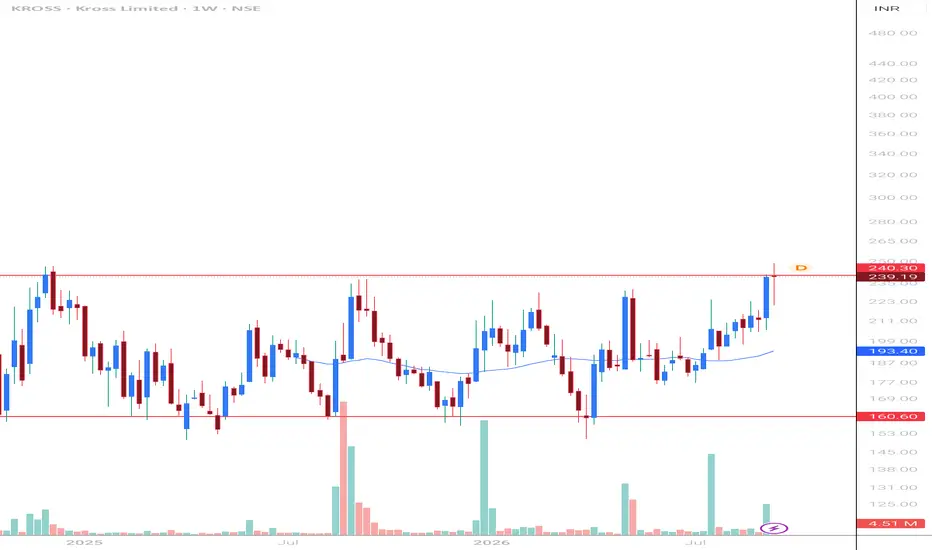
Kross Ltd is testing a major resistance level near ₹240 on the weekly timeframe. The stock has been building a wide base between ₹150–₹240, with strong green volume candles indicating accumulation during upward swings.
Technical Breakdown:
Timeframe: Weekly (1W)
Resistance Level: ₹240
Support Zone: ₹150 – ₹175
Volume Profile: Rising buyer volume on bullish weeks
Fundamental Snapshot:
Market Cap: ₹1,564 Cr (Small Cap)
P/E (TTM): 27.05 vs. Industry P/E: 45.46 (Trading at a discount relative to peers)
Debt to Equity: 0.11 (Virtually debt-free balance sheet)
1Y TTM Profit Growth: +24%
Trading Strategy / Setup:
Breakout Watch: Looking for a decisive weekly candle close above ₹240 to confirm the breakout.
Alternative Entry: Re-entry/continuation on a successful retest of the ₹240 level post-breakout.
(For educational purposes only. Not financial advice. Please perform your own due diligence before taking any position.)
Technical Breakdown:
Timeframe: Weekly (1W)
Resistance Level: ₹240
Support Zone: ₹150 – ₹175
Volume Profile: Rising buyer volume on bullish weeks
Fundamental Snapshot:
Market Cap: ₹1,564 Cr (Small Cap)
P/E (TTM): 27.05 vs. Industry P/E: 45.46 (Trading at a discount relative to peers)
Debt to Equity: 0.11 (Virtually debt-free balance sheet)
1Y TTM Profit Growth: +24%
Trading Strategy / Setup:
Breakout Watch: Looking for a decisive weekly candle close above ₹240 to confirm the breakout.
Alternative Entry: Re-entry/continuation on a successful retest of the ₹240 level post-breakout.
(For educational purposes only. Not financial advice. Please perform your own due diligence before taking any position.)

免责声明
这些信息和出版物并非旨在提供,也不构成TradingView提供或认可的任何形式的财务、投资、交易或其他类型的建议或推荐。请阅读使用条款了解更多信息。
免责声明
这些信息和出版物并非旨在提供,也不构成TradingView提供或认可的任何形式的财务、投资、交易或其他类型的建议或推荐。请阅读使用条款了解更多信息。