
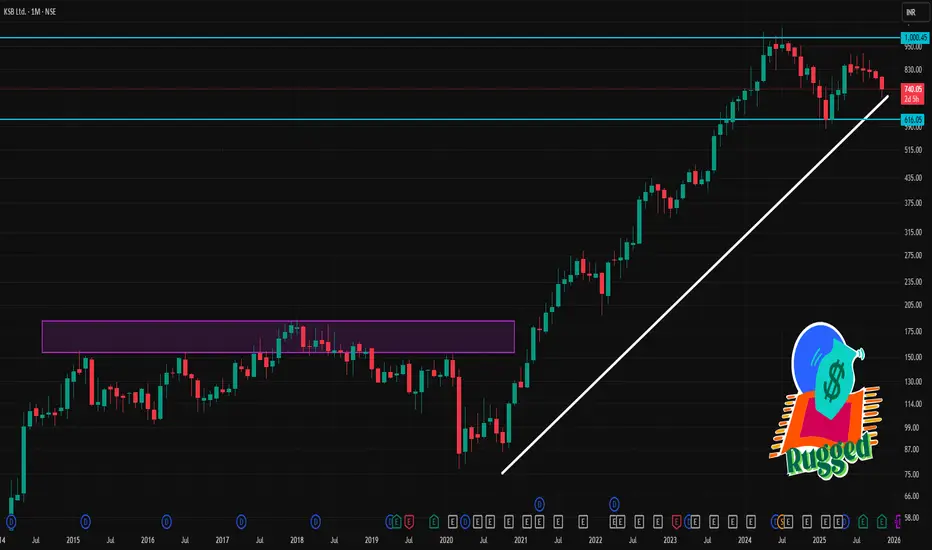
📊 Recent Price & Context
1. As of this week, KSB share price is trading around ₹ 740–748.
2. Over the past 1 month, the stock has seen a decline: some data suggest ~–10% to –12% monthly movement.
3. 52-week trading range: ~₹ 582 (low) to ~₹ 912 (high).
⭐ What this implies (1-Month Outlook)
Base case (neutral / consolidation): Price may hover between ₹ 702–750, possibly swinging around support-resistance zones if broader markets remain stable.
Bullish near-term bounce: If sentiment or fundamentals improve (orders, demand, sector enthusiasm), KSB could test ₹ 738–750 — a key resistance cluster.
Bearish downside: Weak macro or sector headwinds might push price toward ₹ 690, or — if broken — towards ₹ 678.
1. As of this week, KSB share price is trading around ₹ 740–748.
2. Over the past 1 month, the stock has seen a decline: some data suggest ~–10% to –12% monthly movement.
3. 52-week trading range: ~₹ 582 (low) to ~₹ 912 (high).
⭐ What this implies (1-Month Outlook)
Base case (neutral / consolidation): Price may hover between ₹ 702–750, possibly swinging around support-resistance zones if broader markets remain stable.
Bullish near-term bounce: If sentiment or fundamentals improve (orders, demand, sector enthusiasm), KSB could test ₹ 738–750 — a key resistance cluster.
Bearish downside: Weak macro or sector headwinds might push price toward ₹ 690, or — if broken — towards ₹ 678.

Contact Knowledgehub for a detailed consultation: Dm on WhatsApp: [wa.link/a2o0kz]-
Phone No: [+91 93102 26243]-
Email: [tradingviewknowledgehub@gmail.com]---
-- Let’s achieve success together!
Phone No: [+91 93102 26243]-
Email: [tradingviewknowledgehub@gmail.com]---
-- Let’s achieve success together!
相关出版物
免责声明
这些信息和出版物并非旨在提供,也不构成TradingView提供或认可的任何形式的财务、投资、交易或其他类型的建议或推荐。请阅读使用条款了解更多信息。
Contact Knowledgehub for a detailed consultation: Dm on WhatsApp: [wa.link/a2o0kz]-
Phone No: [+91 93102 26243]-
Email: [tradingviewknowledgehub@gmail.com]---
-- Let’s achieve success together!
Phone No: [+91 93102 26243]-
Email: [tradingviewknowledgehub@gmail.com]---
-- Let’s achieve success together!
相关出版物
免责声明
这些信息和出版物并非旨在提供,也不构成TradingView提供或认可的任何形式的财务、投资、交易或其他类型的建议或推荐。请阅读使用条款了解更多信息。