
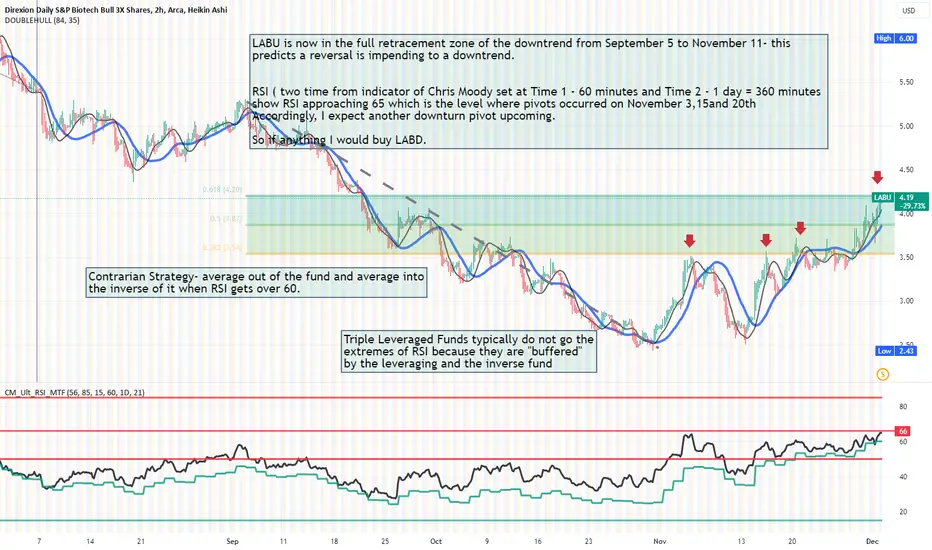
LABU is shown here on a 2H time frame. I am holding 500 shares having bought November 14th
on golden cross of fast and slow hull moving averages. The unrealized gain is 50%.
Here, I determine that I should en bloc or in increments close the position.
First, on the dual time RSI indicator of Chris Moody, the RSI is now over 60 and approaching
65. Price pivoted when RSI was in this range as shown by the red down arrows on the chart.
A fibonacci analysis is that the LABU downtrend of early September to late October has now
retraced in the range of 50% with the mid levels shown on the chart from the drawing tool.
Because of these two considerations, I believe that I should bank the 50% profit in less than
3 weeks and perhaps take a position in the inverse ETF LABD. I will do this on a 15 minute
time frame, take off one fifth of the position daily at the high of day as determined by an
alert for the faster Hull Moving Average doing down instead of upsloping. At the same time
on the LABD 15 minute chart I will buy a corresponding position at the low of day again using
an alert. By the end of the five days, the LABU position will be closed and the profits
redeployed into LABD. When LABD retraces 505 of its downtrend and RSI rises above 60, I will
consider fading the position and retaking a position in LABU. thus toggling positions in the
inverse ETFs as analysis and indicators dictate.

免责声明
这些信息和出版物并非旨在提供,也不构成TradingView提供或认可的任何形式的财务、投资、交易或其他类型的建议或推荐。请阅读使用条款了解更多信息。
免责声明
这些信息和出版物并非旨在提供,也不构成TradingView提供或认可的任何形式的财务、投资、交易或其他类型的建议或推荐。请阅读使用条款了解更多信息。