
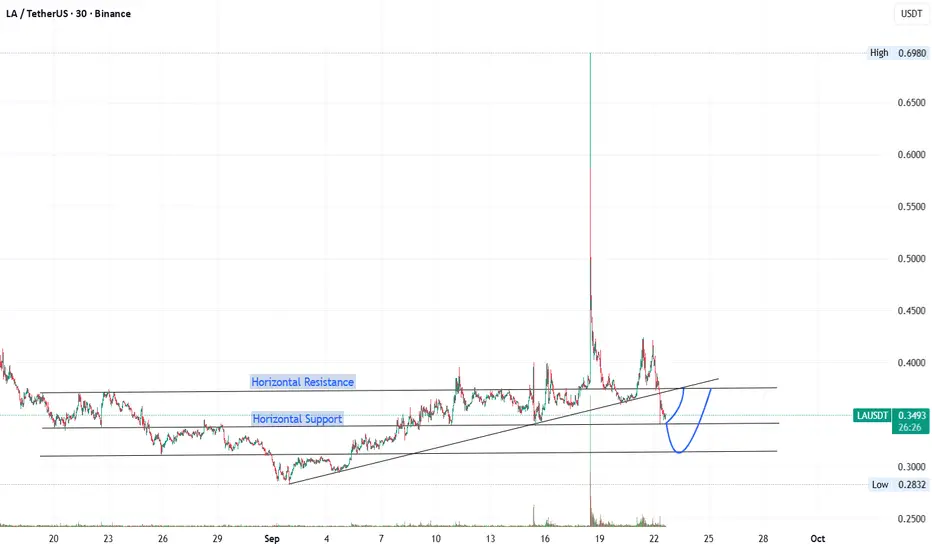
Support levels: You’ve correctly marked two horizontal supports. The lower one around 0.283 (recent low) and the higher one around 0.34–0.35 zone.
Trendline: There’s a clear ascending trendline, which price briefly broke below before bouncing back.
Volume spike: That huge wick up to 0.6980 looks like a liquidity grab or abnormal spike, not a sustained move.
Current structure: Price is testing the horizontal support at ~0.34 after breaking trendline support. Your curved arrow suggests a rebound from support back toward resistance.
Trendline: There’s a clear ascending trendline, which price briefly broke below before bouncing back.
Volume spike: That huge wick up to 0.6980 looks like a liquidity grab or abnormal spike, not a sustained move.
Current structure: Price is testing the horizontal support at ~0.34 after breaking trendline support. Your curved arrow suggests a rebound from support back toward resistance.
- Bullish scenario: Hold above 0.34 → retest 0.38–0.40 area.
- Bearish scenario: Lose 0.34 → likely retest 0.28.

免责声明
这些信息和出版物并非旨在提供,也不构成TradingView提供或认可的任何形式的财务、投资、交易或其他类型的建议或推荐。请阅读使用条款了解更多信息。
免责声明
这些信息和出版物并非旨在提供,也不构成TradingView提供或认可的任何形式的财务、投资、交易或其他类型的建议或推荐。请阅读使用条款了解更多信息。