
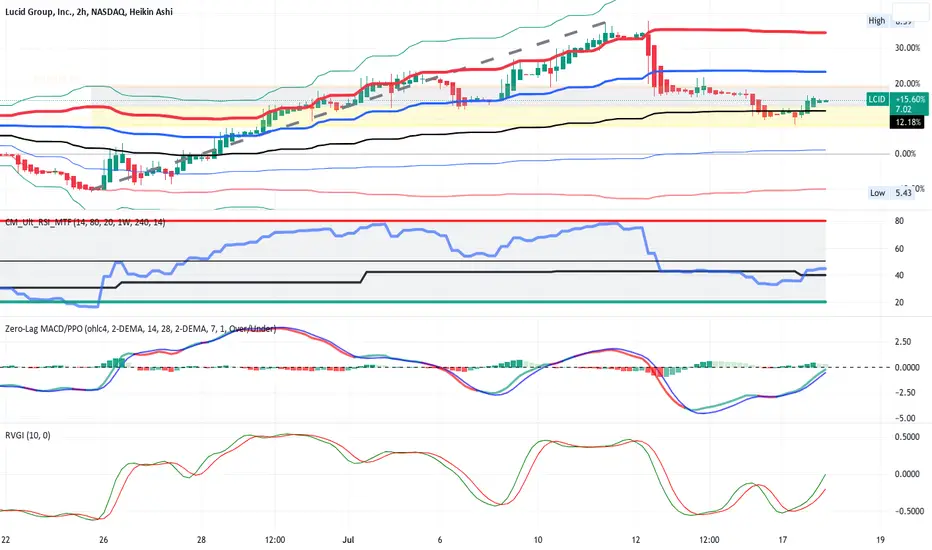
LCID trended up 40% from late June and then over 2-3 days completed a standard
Fib 0.5 retracement before bouncing off a longterm anchored mean VWAP and
reversing. The reversal is supported by the two time frame RSI indicator showing
the lower TF RSI crossing above the higher TF RSI and both of them approaching
the 50 level. The zero lag MACD shows the lines crossed under the histogram and
are now approaching the horizontal zero line. The relative rigor indicator shows
a line cross while the values were negative and now approach to the horizontal
zero line in parallel. Overall I conclude that LCID is set up for a long entry.
Fib 0.5 retracement before bouncing off a longterm anchored mean VWAP and
reversing. The reversal is supported by the two time frame RSI indicator showing
the lower TF RSI crossing above the higher TF RSI and both of them approaching
the 50 level. The zero lag MACD shows the lines crossed under the histogram and
are now approaching the horizontal zero line. The relative rigor indicator shows
a line cross while the values were negative and now approach to the horizontal
zero line in parallel. Overall I conclude that LCID is set up for a long entry.
交易开始
Nice price action in two days. Stop even 2% above break even- Anticipate taking a partial profit on Friday morning before the end of week sell off. Options at 36% ROIthus far.
注释
Trade active:LCID moved higher. Took partial profit on half the call otpions at share price of $3.05. Price pulled back ina Fib Retrace. Reloaded at the pullback. A typical zig-zag strategy. Holing beyond this week. Looking for LCID to get more trader attention as TSLA struggles and FSR is all just become extinct.

免责声明
这些信息和出版物并非旨在提供,也不构成TradingView提供或认可的任何形式的财务、投资、交易或其他类型的建议或推荐。请阅读使用条款了解更多信息。
免责声明
这些信息和出版物并非旨在提供,也不构成TradingView提供或认可的任何形式的财务、投资、交易或其他类型的建议或推荐。请阅读使用条款了解更多信息。