
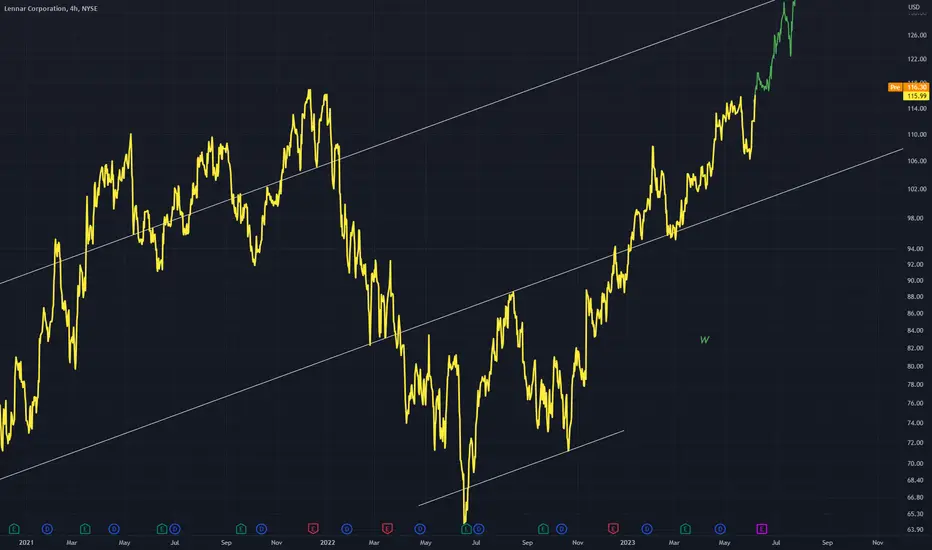
A W pattern on this 4Hr chart.
Basically price just plays out in the shape of a W with the right arm being the main bullish phase which can be seen on chart.
The middle does not necessarily have to be lower (as it is on this chart) for it to be a W pattern still.
Basically price just plays out in the shape of a W with the right arm being the main bullish phase which can be seen on chart.
The middle does not necessarily have to be lower (as it is on this chart) for it to be a W pattern still.

免责声明
这些信息和出版物并非旨在提供,也不构成TradingView提供或认可的任何形式的财务、投资、交易或其他类型的建议或推荐。请阅读使用条款了解更多信息。