
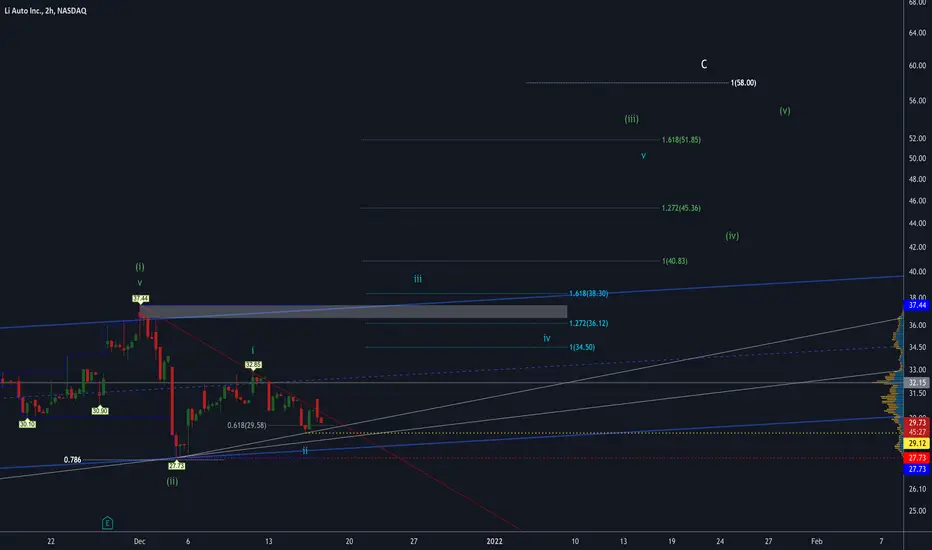
Elliott Wave count I’m following:
White = I’m doing a larger degree ABC count
--> Target upside is $58 longer term
Green = Looks like coming off wave (ii) retrace around $27.73. Green count is within White C.
--> Target upside $40; $50
Light Blue = smaller degree count within green wave (iii). Counting that we put in light blue wave “i” and wave “ii” and we are potentially starting a blue wave "iii". This would align with EW theory that wave 3's are most powerful, indicating the strong move potential to get up and over the red down trend resistance line.
--> Target upside $38 for light blue “iii”; potential $45+ for longer term light blue “v”
I’m just in a small, long call spread weeks out. The yellow dotted line represents potential EW count invalidation for light blue below $29. Below $27.73 could be considered as overall invalidation and price movement creating overall different structure
White = I’m doing a larger degree ABC count
--> Target upside is $58 longer term
Green = Looks like coming off wave (ii) retrace around $27.73. Green count is within White C.
--> Target upside $40; $50
Light Blue = smaller degree count within green wave (iii). Counting that we put in light blue wave “i” and wave “ii” and we are potentially starting a blue wave "iii". This would align with EW theory that wave 3's are most powerful, indicating the strong move potential to get up and over the red down trend resistance line.
--> Target upside $38 for light blue “iii”; potential $45+ for longer term light blue “v”
I’m just in a small, long call spread weeks out. The yellow dotted line represents potential EW count invalidation for light blue below $29. Below $27.73 could be considered as overall invalidation and price movement creating overall different structure

免责声明
这些信息和出版物并非旨在提供,也不构成TradingView提供或认可的任何形式的财务、投资、交易或其他类型的建议或推荐。请阅读使用条款了解更多信息。