
Overview
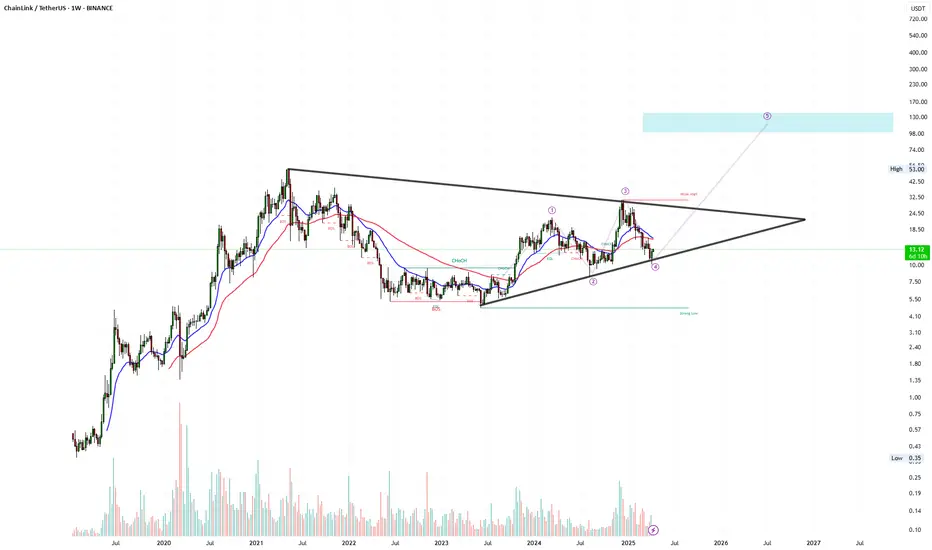
Chainlink (LINK) is experiencing an interesting price movement on the weekly timeframe, forming a Symmetric Triangle pattern. This pattern is a strong technical formation that often precedes significant price movements upon breaking one of its sides. This analysis focuses on the pattern, key resistance and support levels, and price expectations if the resistance is broken.
Symmetric Triangle Pattern
Pattern Formation: The Symmetric Triangle forms as price volatility gradually contracts, creating two converging trendlines (a descending resistance line and an ascending support line). On Chainlink’s weekly timeframe, this pattern is clearly visible, indicating a consolidation period before a major price move.
Time Duration: The pattern has persisted for several weeks, enhancing its technical significance, as longer-term patterns are generally more reliable.
Trading Volume: A gradual decrease in trading volume is observed as the price approaches the triangle’s apex, a typical behavior reflecting traders’ anticipation of an imminent breakout.

免责声明
这些信息和出版物并非旨在提供,也不构成TradingView提供或认可的任何形式的财务、投资、交易或其他类型的建议或推荐。请阅读使用条款了解更多信息。
免责声明
这些信息和出版物并非旨在提供,也不构成TradingView提供或认可的任何形式的财务、投资、交易或其他类型的建议或推荐。请阅读使用条款了解更多信息。