
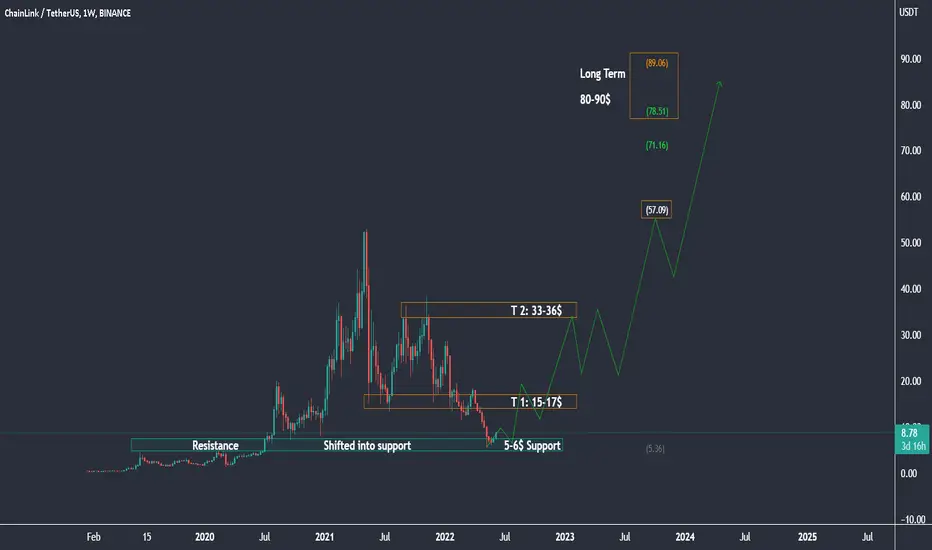
in this chart you can see Chainlink chart (LINKUSDT)
I was share my knowledge and my view as well,
Chainlink current market rank #21 and it's fundamentally strong project,
We can clearly seen Link hold two years old support $5-6
July 2020 Link break this Resistance level and hit ATH $53 in may 2021,
After that we can see rejection from $53 and price start going downside,
finally hit $5.5 in may 2022 and it's a strong Support Zone now,
So if you're looking to buy and hold this fundamentally strong project Chainlink,
I was explain everything in this chart.
What our buying zone and also our target for mid-term and long-term as well.
Wish you all the best.
Make Profit and Remember Rashid
I was share my knowledge and my view as well,
Chainlink current market rank #21 and it's fundamentally strong project,
We can clearly seen Link hold two years old support $5-6
July 2020 Link break this Resistance level and hit ATH $53 in may 2021,
After that we can see rejection from $53 and price start going downside,
finally hit $5.5 in may 2022 and it's a strong Support Zone now,
So if you're looking to buy and hold this fundamentally strong project Chainlink,
I was explain everything in this chart.
What our buying zone and also our target for mid-term and long-term as well.
Wish you all the best.
Make Profit and Remember Rashid

免责声明
这些信息和出版物并非旨在提供,也不构成TradingView提供或认可的任何形式的财务、投资、交易或其他类型的建议或推荐。请阅读使用条款了解更多信息。
免责声明
这些信息和出版物并非旨在提供,也不构成TradingView提供或认可的任何形式的财务、投资、交易或其他类型的建议或推荐。请阅读使用条款了解更多信息。