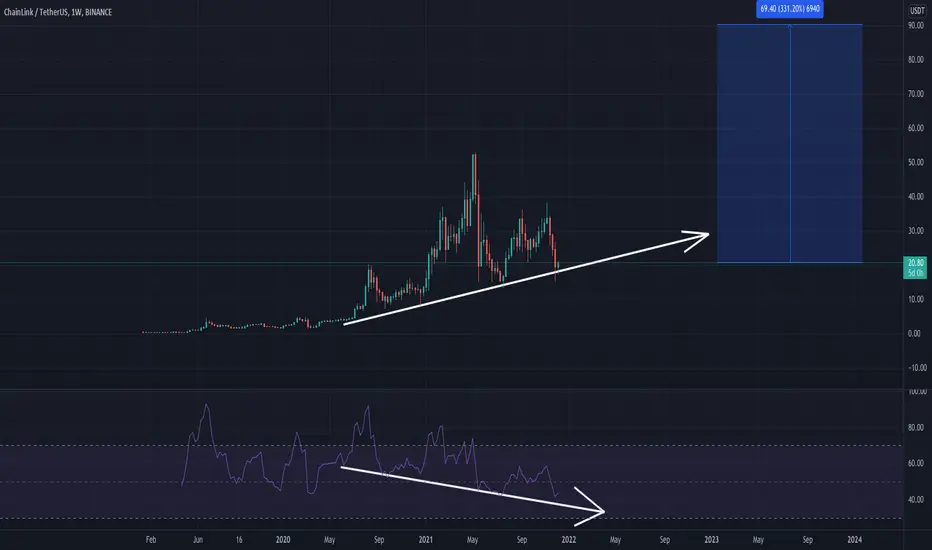

 LINKUSDT is a monster in disguise, with a huge surprise waiting around the corner.
 On the weekly timeframe chart, we can see a monster-sized hidden bullish divergence. The price action has been printing higher lows, while the RSI has been printing lower lows. By definition, this is a hidden bullish divergence. Something like this appearing on a high time frame, in our example the 1-Week time frame, can only mean one thing: a huge move on the upside is waiting for us.
Fundamentally,
LINKUSDT is also a fantastic project, having just partnered up with the former GOOGLE CEO - Eric Schmidt. I have never been so excited for a project before! Good luck,
Your Ganbu
⚠️ Let me know your feedback and comments below!
⚠️ Follow me if you would like to see more analysis like this

免责声明
这些信息和出版物并非旨在提供,也不构成TradingView提供或认可的任何形式的财务、投资、交易或其他类型的建议或推荐。请阅读使用条款了解更多信息。