
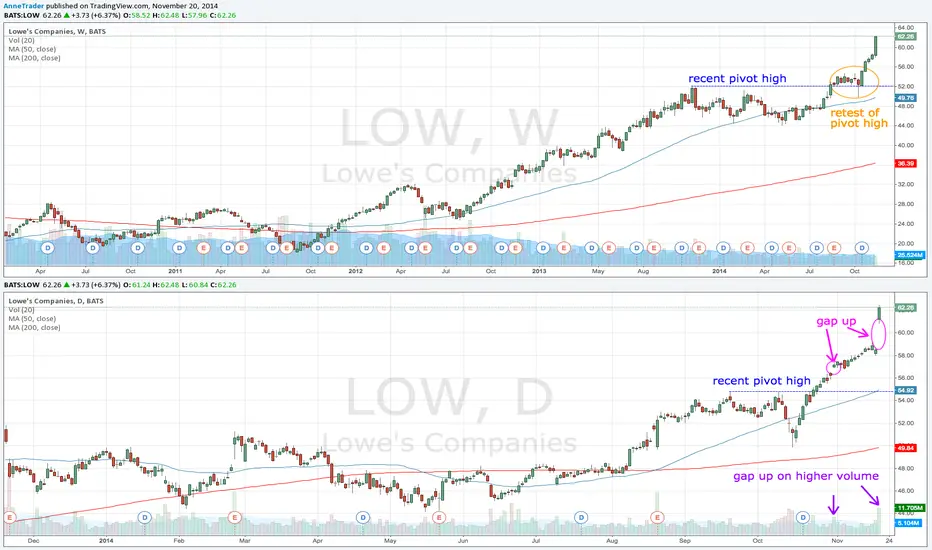
LOW has been trending up since late 2012 but the ride has not always been smooth. From November 2013 to August 2014 price was stuck in a prolonged pullback/consolidation around $50. Then in late August price broke above the November 2013 pivot high, retested it (see the weekly chart) with a spike below the resistance-turned-support and continued it's upward momentum.
On the daily chart LOW broke above the 19th September pivot high and a good opportunity to buy into this stock presented itself with the first gap up on 31st October. If you missed this then yesterdays gap offers a second opportunity.
Trading gaps is a near-term strategy but LOW looks in a position to trend over the longer-term, too, so this set-up could apply to either.
On the daily chart LOW broke above the 19th September pivot high and a good opportunity to buy into this stock presented itself with the first gap up on 31st October. If you missed this then yesterdays gap offers a second opportunity.
Trading gaps is a near-term strategy but LOW looks in a position to trend over the longer-term, too, so this set-up could apply to either.

Web: dt.live
Instagram: instagram.com/dynamictrader
Twitter: twitter.com/dynamictrader
Instagram: instagram.com/dynamictrader
Twitter: twitter.com/dynamictrader
免责声明
这些信息和出版物并非旨在提供,也不构成TradingView提供或认可的任何形式的财务、投资、交易或其他类型的建议或推荐。请阅读使用条款了解更多信息。
Web: dt.live
Instagram: instagram.com/dynamictrader
Twitter: twitter.com/dynamictrader
Instagram: instagram.com/dynamictrader
Twitter: twitter.com/dynamictrader
免责声明
这些信息和出版物并非旨在提供,也不构成TradingView提供或认可的任何形式的财务、投资、交易或其他类型的建议或推荐。请阅读使用条款了解更多信息。