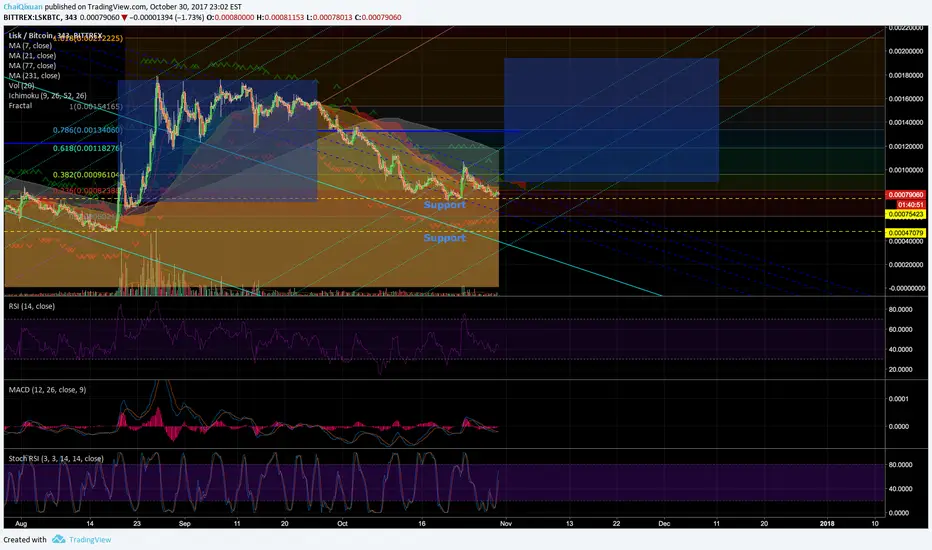
LSK might be breaking out soon just like many other charts.
The chart has been setting up and the lows have been rising.
If the trendline (blue dash lines) holds then we may potentially see a breakout in the blue box area. We "may" see an ATH attempt. However due to the white line (231 MA) being above the orange (77 MA), it acts as a ceiling for the run. Unless we have enough power built up into the buying power, we will not be able to break through in one go. Therefore, leaving us bringing the white line to flatten out and allow the better possiblilty to run to ATH.
The trends have been holding even when btc shot up, that leads me to believe this is the new base established support giving us a small trend reversal.
Like always, please let me know what you think. I welcome all comments, critics, and suggestions to both better my understanding and charting skills.
Cheers.
The chart has been setting up and the lows have been rising.
If the trendline (blue dash lines) holds then we may potentially see a breakout in the blue box area. We "may" see an ATH attempt. However due to the white line (231 MA) being above the orange (77 MA), it acts as a ceiling for the run. Unless we have enough power built up into the buying power, we will not be able to break through in one go. Therefore, leaving us bringing the white line to flatten out and allow the better possiblilty to run to ATH.
The trends have been holding even when btc shot up, that leads me to believe this is the new base established support giving us a small trend reversal.
Like always, please let me know what you think. I welcome all comments, critics, and suggestions to both better my understanding and charting skills.
Cheers.

免责声明
这些信息和出版物并非旨在提供,也不构成TradingView提供或认可的任何形式的财务、投资、交易或其他类型的建议或推荐。请阅读使用条款了解更多信息。
免责声明
这些信息和出版物并非旨在提供,也不构成TradingView提供或认可的任何形式的财务、投资、交易或其他类型的建议或推荐。请阅读使用条款了解更多信息。