做多
LISK GOES UP
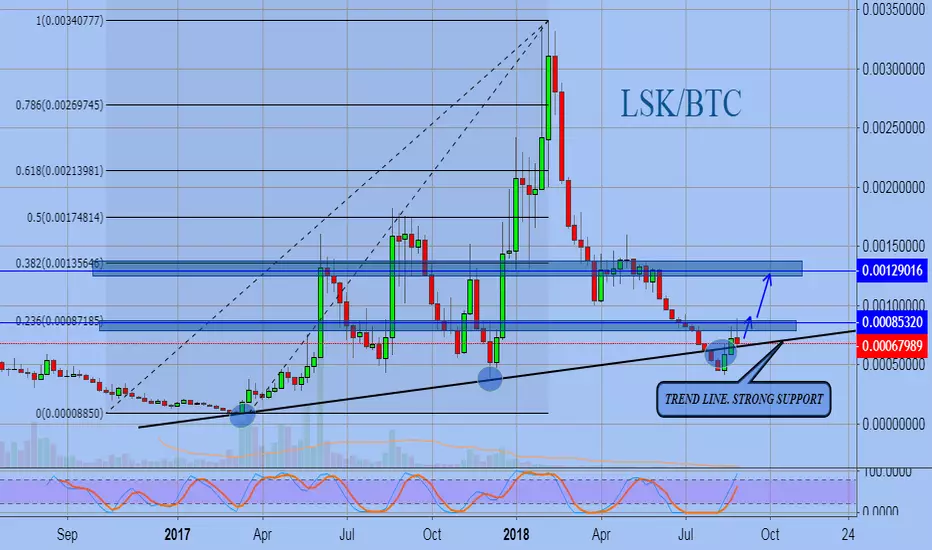
LISK is at the trend line, the chart shows the areas of contact of the support line. During the last touch, the trend line broke through, but the asset quickly returned to the growth zone.
Now the LISK is testing the support line, and then, with a high probability, it has grown at least to the 0.236 and 0.382 of the last asset growth.
Zone of resistance indicated.
Take profit - blue horizontal line
Now the LISK is testing the support line, and then, with a high probability, it has grown at least to the 0.236 and 0.382 of the last asset growth.
Zone of resistance indicated.
Take profit - blue horizontal line

免责声明
这些信息和出版物并非旨在提供,也不构成TradingView提供或认可的任何形式的财务、投资、交易或其他类型的建议或推荐。请阅读使用条款了解更多信息。
免责声明
这些信息和出版物并非旨在提供,也不构成TradingView提供或认可的任何形式的财务、投资、交易或其他类型的建议或推荐。请阅读使用条款了解更多信息。