
Overview
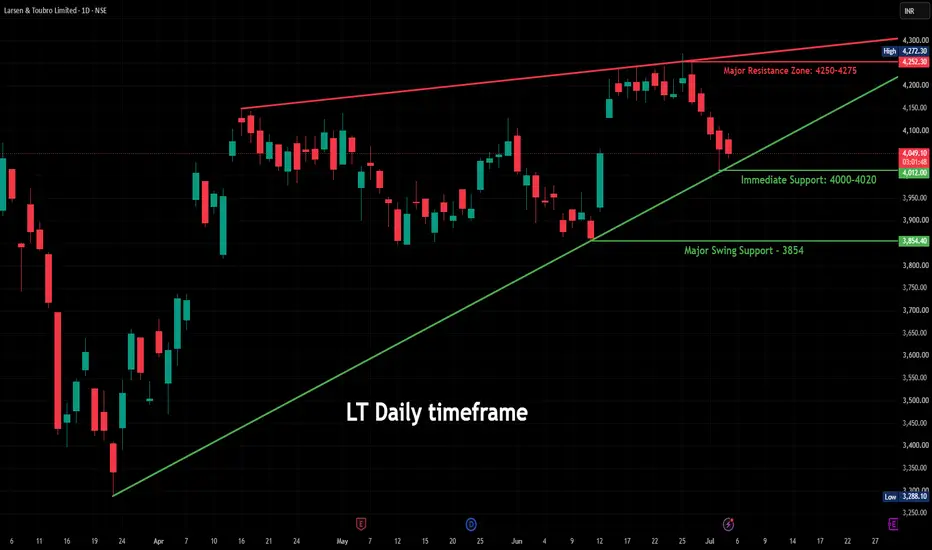
Larsen & Toubro (LT) has entered a healthy pullback after facing rejection from the 4250–4275 resistance zone. Despite the recent decline, the broader market structure remains constructive, with price approaching a rising trendline that has acted as dynamic support over the past few months.
The current setup places LT at an important technical decision point.
Chart Structure
The rising trendline has consistently attracted buyers during previous corrections, making the 4000–4020 region an important area to monitor.
At the same time, the 4250–4275 zone has emerged as a significant resistance where sellers have repeatedly capped upside momentum.
As long as price continues to respect the ascending trendline, the broader structure remains intact.
Key Levels
🟢 Immediate Support: 4000–4020
Rising trendline support
Maintaining this level keeps the current structure positive
🔴 Major Resistance: 4250–4275
Multiple rejections from this zone
A decisive breakout could indicate renewed bullish momentum
🟢 Major Swing Support: 3854
Next significant support if trendline support fails
What to Watch
Bullish Case
Price stabilizes above 4000–4020
Buyers defend the rising trendline
Momentum gradually improves toward the resistance zone
Bearish Case
A sustained close below trendline support may increase selling pressure
3854 becomes the next important technical level
Final Thoughts
Rather than predicting the next move, this chart highlights an important technical area where price may react.
The coming sessions should provide additional confirmation on whether buyers can defend the rising trendline or whether the current pullback develops into a deeper correction.
Key Levels
Support: 4000–4020
Resistance: 4250–4275
Major Swing Support: 3854
Trade with confirmation and appropriate risk management.
Larsen & Toubro (LT) has entered a healthy pullback after facing rejection from the 4250–4275 resistance zone. Despite the recent decline, the broader market structure remains constructive, with price approaching a rising trendline that has acted as dynamic support over the past few months.
The current setup places LT at an important technical decision point.
Chart Structure
The rising trendline has consistently attracted buyers during previous corrections, making the 4000–4020 region an important area to monitor.
At the same time, the 4250–4275 zone has emerged as a significant resistance where sellers have repeatedly capped upside momentum.
As long as price continues to respect the ascending trendline, the broader structure remains intact.
Key Levels
🟢 Immediate Support: 4000–4020
Rising trendline support
Maintaining this level keeps the current structure positive
🔴 Major Resistance: 4250–4275
Multiple rejections from this zone
A decisive breakout could indicate renewed bullish momentum
🟢 Major Swing Support: 3854
Next significant support if trendline support fails
What to Watch
Bullish Case
Price stabilizes above 4000–4020
Buyers defend the rising trendline
Momentum gradually improves toward the resistance zone
Bearish Case
A sustained close below trendline support may increase selling pressure
3854 becomes the next important technical level
Final Thoughts
Rather than predicting the next move, this chart highlights an important technical area where price may react.
The coming sessions should provide additional confirmation on whether buyers can defend the rising trendline or whether the current pullback develops into a deeper correction.
Key Levels
Support: 4000–4020
Resistance: 4250–4275
Major Swing Support: 3854
Trade with confirmation and appropriate risk management.
注释
Update — Major Support Broken, Now Testing the 0.5 Fib Zone
Quick note on this one. Since we posted, price broke below both the Immediate Support (4,000–4,020) and the Major Swing Support at 3,854. Today it closed at 3,783.90, down 1.68%.
Interesting bit — this close is landing almost exactly on the 0.5 Fib level (3,780.20) as drawn fib retracement drawing. So while the swing support didn't hold, price has dropped right into another meaningful zone.
What to watch now:
Can price hold above 3,780? If yes, this Fib zone could act as the next support
If it breaks below 3,780 too, the next levels to watch are 3,664 (0.618 Fib) and then 3,598 (0.786 Fib)
Bottom line: the support we flagged earlier gave way, but price has landed almost perfectly on the next natural level below it. As always, let's wait and see if this one holds before assuming anything.
Educational purposes only. Not financial advice.

📈 HK Trading Community | Market Structure & Indicator Updates
Telegram: t.me/trendstrike1000
Website: quantumedgepro.netlify.app/
Real traders are built through learning,not tip hunting.So Start Learning How the Market Really Works
Telegram: t.me/trendstrike1000
Website: quantumedgepro.netlify.app/
Real traders are built through learning,not tip hunting.So Start Learning How the Market Really Works
免责声明
这些信息和出版物并非旨在提供,也不构成TradingView提供或认可的任何形式的财务、投资、交易或其他类型的建议或推荐。请阅读使用条款了解更多信息。
📈 HK Trading Community | Market Structure & Indicator Updates
Telegram: t.me/trendstrike1000
Website: quantumedgepro.netlify.app/
Real traders are built through learning,not tip hunting.So Start Learning How the Market Really Works
Telegram: t.me/trendstrike1000
Website: quantumedgepro.netlify.app/
Real traders are built through learning,not tip hunting.So Start Learning How the Market Really Works
免责声明
这些信息和出版物并非旨在提供,也不构成TradingView提供或认可的任何形式的财务、投资、交易或其他类型的建议或推荐。请阅读使用条款了解更多信息。