
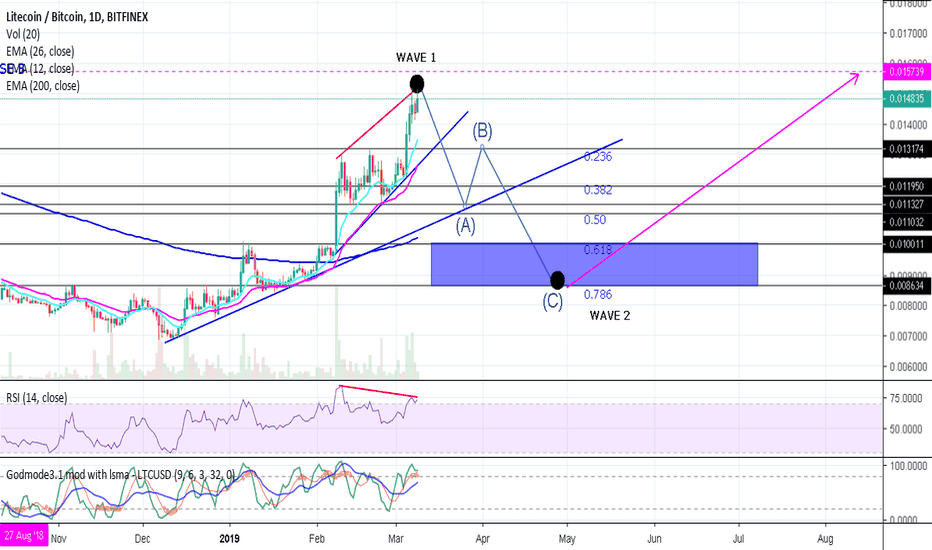
Hi friends! Welcome to Litecoin Chart Update to trading idea published on March 9.
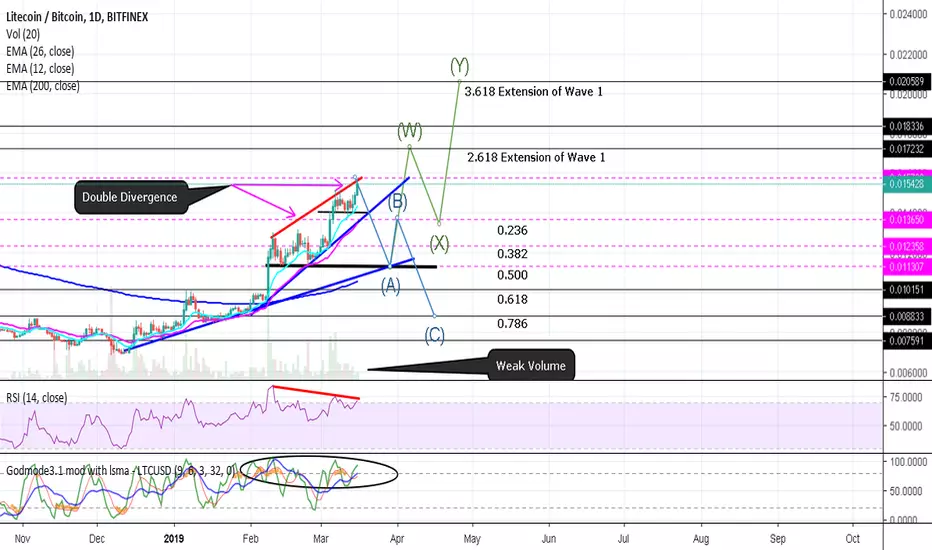
The recent rally we've seen on
 LTC which brought the price 4% higher has ignored the bearish divergence signal and may have liquidated many shorts at this point but this signal was not invalidated. Instead a double divergence appeared (as shown on the chart) as a result of the rally which means the previous bearish signal was further strengthened. Double divergence are stronger signals than a regular divergence. Relatedly the volume of the last rally was very weak which signifies a decrease in the momentum.
We are seeing two probable scenarios for
LTC long term. Both scenarios requires a correction at the 50% fib level of the entire move (see confluence between support line blue and support line black).Scenario 1 (Green)-This scenario was derived from a possibility that
LTC is in an accumulation on an expanding channel which will be very bullish for $LTC. This could propel LTC to 2.618 Fib extention and 3.618 Fib extension of the previous wave 1. This move will result to 80% rally from our downside target.Scenario 2 (Blue)- This scenario works on the premise that the upside objective for
LTC has already been reached and requires a correction before the resumption of a larger bullish trend. This means that we will likely have a short bounce at 0.5 fib level before we could reach the downside target at 0.786 fib level.IMO scenario blue is more likely to playout. That's it friends.
Share you thoughts with me in the comment section. Thanks
This is just a guide, not a trading advise.
Hit like and follow for more chart updates!
Thanks
-Your Poop Trader
注释
Its becoming very clear now. LTC trend support fails. 注释
The breakdown, support becomes resistance. 
相关出版物
免责声明
这些信息和出版物并非旨在提供,也不构成TradingView提供或认可的任何形式的财务、投资、交易或其他类型的建议或推荐。请阅读使用条款了解更多信息。