
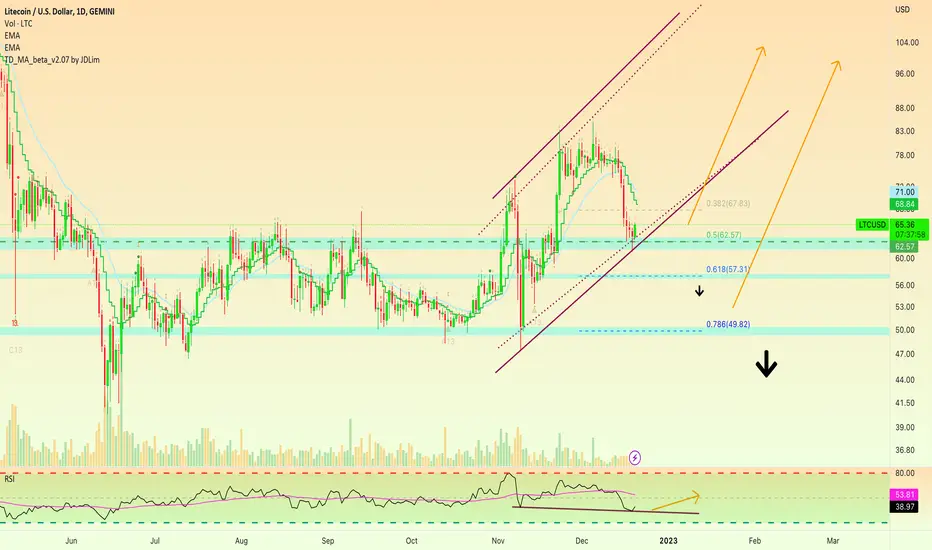
When we look at the last three candles on the Litecoin vs USD chart (LTCUSD) we have a potential reversal pattern... Not yet complete/confirmed.
If Litecoin were to close daily/today above $66 this would send out a strong bullish signal.
Support was found at the 0.5 Fib. retracement level.
While this isn't the 0.618 nor 0.786 Fib. level, when a pair is really strong it can recover sooner such as 0.5 or 0.382 Fib.
This is the case with Litecoin.
We know it has been strong because it moved ahead of the entire market.
Another signal is a hidden bullish divergence short-term.
Looking at November vs December, LTCUSD hits a higher low.
The RSI on this same date hits a lower low... This is a hidden bullish divergence and while a short-term one it is really strong.
There is growth potential.
Higher lows tend to lead to higher high... So prepare!
Namaste.
注释
Its bouncing... So far it looks good.
💯 Trading signals (results)
— Late 2026👇
t.me/masteranandatrades/9279
🔥 10-25X Leverage
—Trade-numbers:
t.me/masteranandatrades/9271
✅ PREMIUM &Content
—One-Time Payment
t.me/lamatrades/4 (🔝 since 2017)
— Late 2026👇
t.me/masteranandatrades/9279
🔥 10-25X Leverage
—Trade-numbers:
t.me/masteranandatrades/9271
✅ PREMIUM &Content
—One-Time Payment
t.me/lamatrades/4 (🔝 since 2017)
相关出版物
免责声明
这些信息和出版物并非旨在提供,也不构成TradingView提供或认可的任何形式的财务、投资、交易或其他类型的建议或推荐。请阅读使用条款了解更多信息。