
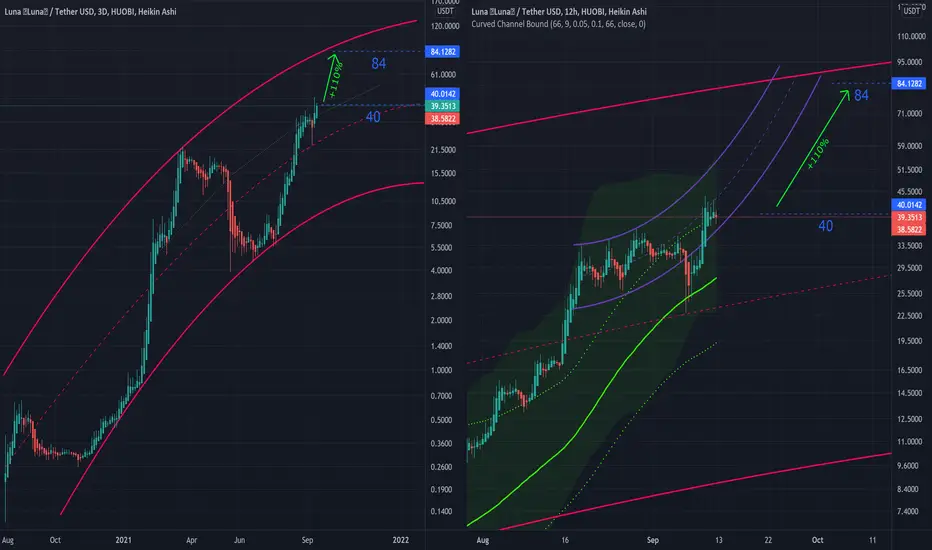
On the LEFT chart there is a big picture of the actual LUNA channel on 3 days candle timeframe.
On the RIGHT chart there is a close up trying to pinpoint dynamic supports (green lines) and limits (green slime) using my curved boundaries indicator. On Violet there is an attempt to find the trajectory where the price can reach the final resistance of this run.
Just sharing my personal charts for learning purposes only. This is not an investment recommendation.
On the RIGHT chart there is a close up trying to pinpoint dynamic supports (green lines) and limits (green slime) using my curved boundaries indicator. On Violet there is an attempt to find the trajectory where the price can reach the final resistance of this run.
Just sharing my personal charts for learning purposes only. This is not an investment recommendation.

免责声明
这些信息和出版物并非旨在提供,也不构成TradingView提供或认可的任何形式的财务、投资、交易或其他类型的建议或推荐。请阅读使用条款了解更多信息。
免责声明
这些信息和出版物并非旨在提供,也不构成TradingView提供或认可的任何形式的财务、投资、交易或其他类型的建议或推荐。请阅读使用条款了解更多信息。