 LUNR
--Trend Context:
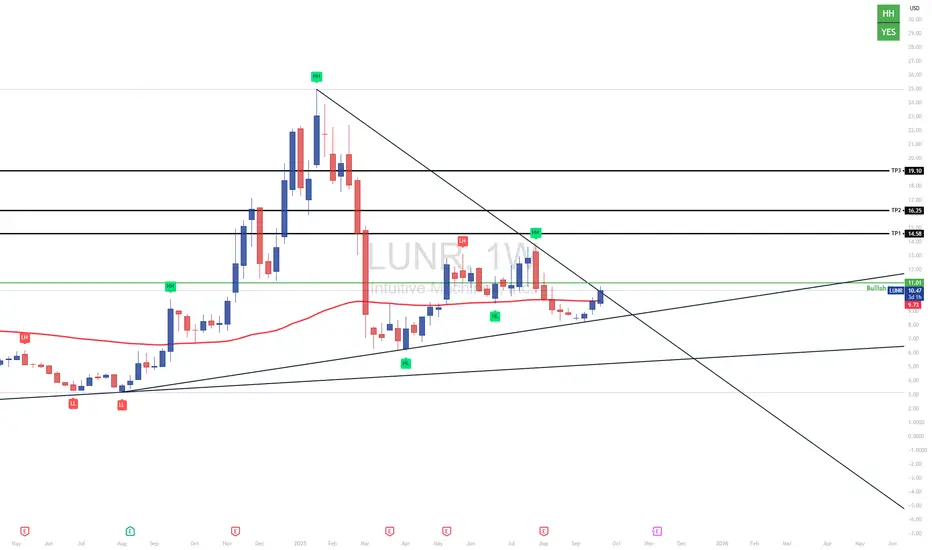
The chart is in a corrective phase after a euphoric run to ~$28. From that top, we had a sharp selloff (distribution phase), followed by sideways compression forming a descending triangle / wedge structure. Now, price is pressing against the upper trendline.
--Key Moving Average (EMA 100, red line):
This line is currently acting as a dynamic resistance zone.
Notice how price has struggled to decisively close above it. Historically, on weekly charts, reclaiming the EMA 100 after a major drawdown is a long-term bullish trigger, often signaling institutional accumulation.
--Levels of Interest
Immediate Resistance: $11.00 (trendline + EMA 100 cluster) – critical pivot.
TP1: $14.58 – previous structural supply.
TP2: $16.75 – mid-distribution zone.
TP3: $19.10 – top of the range before the collapse.
Support: $9.73 (weekly close level + ascending support), below that, $8.00 is your danger zone.
---------------------------------------------------------------------------------------------------
--Market Psychology
Sellers dominated post-top with lower highs.
Recently, we see higher lows forming → this creates a pressure cooker scenario: buyers stepping in earlier while sellers defend the downtrend line.
Breakouts from such wedge patterns often lead to violent directional moves (10–30% weekly candles are common in such setups).
---------------------------------------------------------------------------------------------------
--Probability Outlook
// Bullish Breakout Scenario (Primary Bias):
Close above $11 weekly → confirms breakout from wedge + reclaim of EMA 100.
Momentum traders pile in, targeting $14.5 → $16.75 in short order.
Risk/reward heavily favors bulls if $9.70 holds.
// Bearish Rejection Scenario (Secondary Bias):
Failure at $11 → sharp rejection, retest of $9.70 support.
If $9.70 cracks, we likely revisit $8.00 and potentially re-test lower diagonal ~$6.50
---------------------------------------------------------------------------------------------------
--For Traders:
Entry: Confirmed weekly close > $11.
Stop: Below $9.70 (structural invalidation).
Targets: $14.58 → $16.75 → $19.10.
Risk: Reward ~1:3.
----------------------
--For Investors:
This is the early accumulation zone. Risk remains high, but so does reward. A confirmed reclaim of EMA 100 weekly is historically a trend resumption signal.
----------------------
This chart is at decision point. Institutions and algos are watching the $11 level like hawks. A close above there doesn’t just unlock higher targets—it flips sentiment from “dead cat” to “recovery play.”
Think of this like catching Tesla 2019 or NVDA 2016—if the breakout is confirmed, you’ll see multi-week upside momentum. But discipline is non-negotiable: if it loses $9.70, you step aside fast.

免责声明
这些信息和出版物并非旨在提供,也不构成TradingView提供或认可的任何形式的财务、投资、交易或其他类型的建议或推荐。请阅读使用条款了解更多信息。