
🧠 Mastercard (MA) — In-Depth Multi-Framework Market Analysis
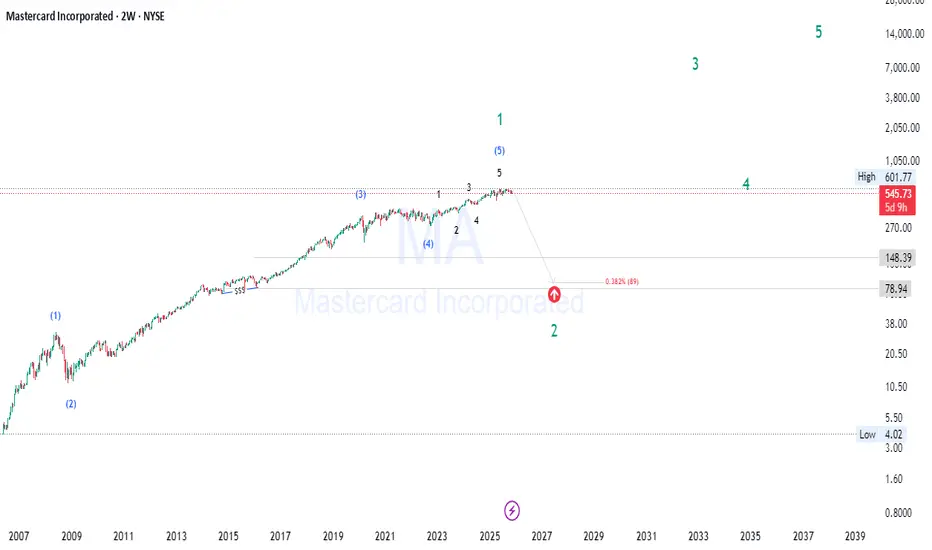
Mastercard’s long bull run has matured into a classic Wave 5 exhaustion.
Multiple frameworks agree: a deep corrective phase is likely ahead.
Understanding market structure, smart money moves, and Fibonacci levels can help you navigate this reset.
🌀 Wave Theory & Elliott Wave Context
Mastercard’s chart shows a clear completed 5-wave impulsive structure spanning roughly 15+ years, typical of a major secular bull cycle. The small sub-waves within Wave 5 suggest final exhaustion:
📉 Market Structure Breakdown & Key Price Action Signals
🧠 Smart Money Concepts (SMC)
📊 Fibonacci Retracement & Extension Levels
💼 Fundamental Context & Market Cycles
🔮 Strategic Outlook & Trading Implications
💡 Key Takeaways for Traders
Stay ahead of the market — follow for advanced wave counts, Fibonacci setups, and smart money insights.
Comment 👇 your ticker to get a personalized deep-dive analysis next! 🚀
Disclaimer:
This analysis is for educational purposes only and does not constitute financial advice. Always conduct your own research and consult a professional before trading.
#Mastercard #MA #WaveTheory #ElliottWave #SmartMoneyConcepts #SMC #Fibonacci #MarketStructure #PriceAction #TradingView #TechnicalAnalysis #StocksToWatch #MarketCycles #LiquidityHunt #TradingEducation #InvestSmart #StockAnalysis
Mastercard’s long bull run has matured into a classic Wave 5 exhaustion.
Multiple frameworks agree: a deep corrective phase is likely ahead.
Understanding market structure, smart money moves, and Fibonacci levels can help you navigate this reset.
🌀 Wave Theory & Elliott Wave Context
Mastercard’s chart shows a clear completed 5-wave impulsive structure spanning roughly 15+ years, typical of a major secular bull cycle. The small sub-waves within Wave 5 suggest final exhaustion:
- Wave 5 ending near key Fibonacci extensions signals an exhaustion climax.
- After such extended waves, expect a significant corrective ABC pattern or even a complex correction resetting much of the prior gains.
- The correction here is likely a large Wave 2 on the higher degree, meaning the retracement could be deep and prolonged, typically lasting multiple years.
📉 Market Structure Breakdown & Key Price Action Signals
- Price has failed to push to new highs with conviction, showing lower highs and a breakdown of previous support levels.
- This breakdown in market structure suggests the shift from an accumulation or markup phase to distribution and markdown.
- Multiple wick rejections and volume spikes near highs imply liquidity sweeps and stop hunts by institutions, signaling transfer of risk.
- Price action shows signs of fatigue — smaller candles, overlapping bars, and diminished momentum — classic exhaustion signals.
🧠 Smart Money Concepts (SMC)
- Institutional players often engineer liquidity grabs above key levels (stop hunts) to shake out retail participants.
- The immediate reversal following those liquidity grabs is a hallmark of distribution, where "smart money" sells into retail enthusiasm.
- The absence of strong demand at these levels reinforces the notion of a shift from bullish to bearish control.
📊 Fibonacci Retracement & Extension Levels
- Wave 5 terminated near the 2.618 Fibonacci extension, an extreme but well-documented exhaustion zone for extended impulses.
- The retracement target aligns with the 0.382 Fibonacci retracement (~$89–95), the first major support for Wave 2 corrections.
- More conservative estimates place support near 0.5–0.618 retracement, which historically mark deep correction zones in longer cycles.
- These levels also coincide with significant prior consolidation zones, increasing their validity as support.
💼 Fundamental Context & Market Cycles
- Mastercard’s underlying fundamentals remain solid, with strong revenue growth and market dominance.
- However, market cycles are driven by liquidity and psychology — no fundamentally strong company is immune to price corrections during macro resets.
- This correction could coincide with broader economic or sector rotation phases, impacting valuation multiples and capital flows.
🔮 Strategic Outlook & Trading Implications
- Expect a multi-year correction phase, potentially volatile, with several retracements and consolidations along the way.
- Patience is key: major Wave 2 corrections often shake out weak holders and reset risk/reward dynamics for the next bull phase (Wave 3).
- Traders should look for confluence zones combining Fibonacci support, prior market structure, and volume profile for entries.
- Watch for price action confirmation of a base formation before resuming a bullish stance.
💡 Key Takeaways for Traders
- Long-term cycle completion means caution: avoid chasing new highs here.
- Use Fibonacci and wave structure to anticipate price targets and exits.
- Monitor volume and liquidity sweeps to identify distribution phases.
- Be prepared for deep, sometimes painful corrections even in high-quality stocks.
- Focus on risk management and position sizing during volatile cycle resets.
Stay ahead of the market — follow for advanced wave counts, Fibonacci setups, and smart money insights.
Comment 👇 your ticker to get a personalized deep-dive analysis next! 🚀
Disclaimer:
This analysis is for educational purposes only and does not constitute financial advice. Always conduct your own research and consult a professional before trading.
#Mastercard #MA #WaveTheory #ElliottWave #SmartMoneyConcepts #SMC #Fibonacci #MarketStructure #PriceAction #TradingView #TechnicalAnalysis #StocksToWatch #MarketCycles #LiquidityHunt #TradingEducation #InvestSmart #StockAnalysis

免责声明
这些信息和出版物并非旨在提供,也不构成TradingView提供或认可的任何形式的财务、投资、交易或其他类型的建议或推荐。请阅读使用条款了解更多信息。