做多
#Matic 1W chart;
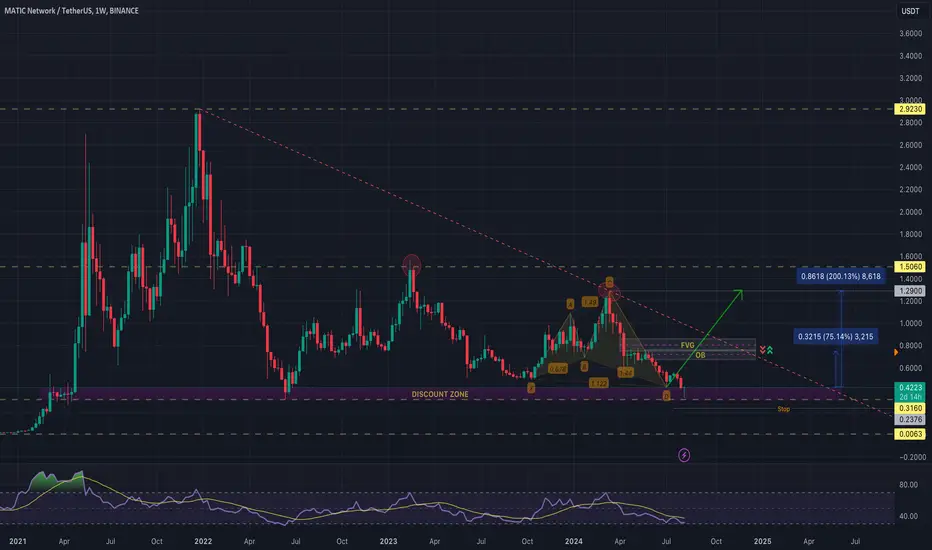
$CRYPTOCAP:MATIC 1W chart;
On the weekly chart, we can see that the balance of February 2023 and March 2024 levels on the RSI side is not reflected in the price (red circles).
It is now at a serious support level and it also seems to have started a bullish pattern from these levels.
As long as it sticks to the stop level, it will not be a surprise to see sharp upward rises after the squeeze between it and the downtrend line it will enter.
The ratio between the pattern target level is 200
However, we can consider OB-FVG regions as a profit-taking level beforehand.
On the weekly chart, we can see that the balance of February 2023 and March 2024 levels on the RSI side is not reflected in the price (red circles).
It is now at a serious support level and it also seems to have started a bullish pattern from these levels.
As long as it sticks to the stop level, it will not be a surprise to see sharp upward rises after the squeeze between it and the downtrend line it will enter.
The ratio between the pattern target level is 200
However, we can consider OB-FVG regions as a profit-taking level beforehand.

For more you can follow me on X. @UgurTash
免责声明
这些信息和出版物并非旨在提供,也不构成TradingView提供或认可的任何形式的财务、投资、交易或其他类型的建议或推荐。请阅读使用条款了解更多信息。
For more you can follow me on X. @UgurTash
免责声明
这些信息和出版物并非旨在提供,也不构成TradingView提供或认可的任何形式的财务、投资、交易或其他类型的建议或推荐。请阅读使用条款了解更多信息。