MATIC/USDT price movement variantes
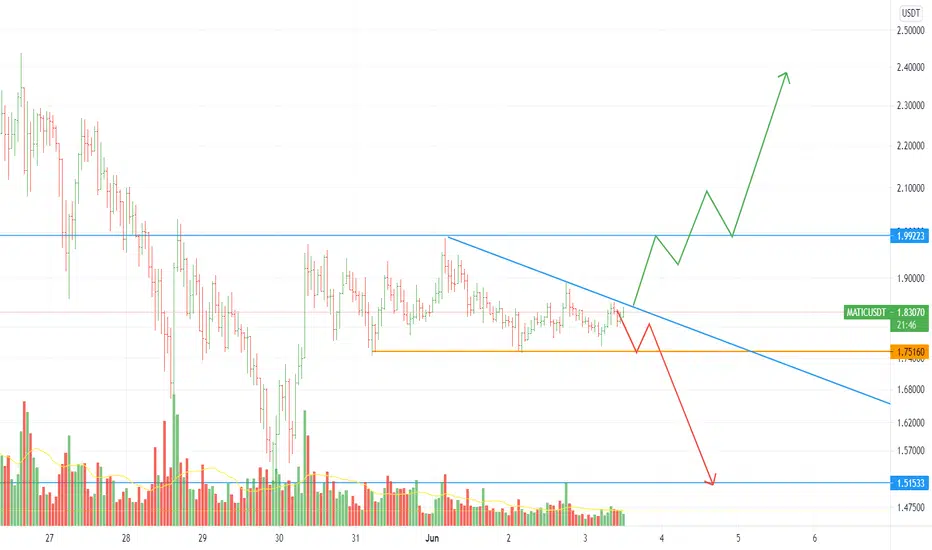
Let’s check the MATIC/USDT pair chart. Daily timeframe shows us that MATIC is trading into the narrow channel between $1.75 and $2. Moreover, we can notice that sellers try to press down the price to the $1.75 and lower. If the price closes under or above $2 it will be a strong signal to purchase MATIC in long. Besides further price movement of this pair depends on BTC. That’s why we need to follow BTC chart to make the right deal.

免责声明
这些信息和出版物并非旨在提供,也不构成TradingView提供或认可的任何形式的财务、投资、交易或其他类型的建议或推荐。请阅读使用条款了解更多信息。
免责声明
这些信息和出版物并非旨在提供,也不构成TradingView提供或认可的任何形式的财务、投资、交易或其他类型的建议或推荐。请阅读使用条款了解更多信息。