MATIC/USDT 1DInterval Review
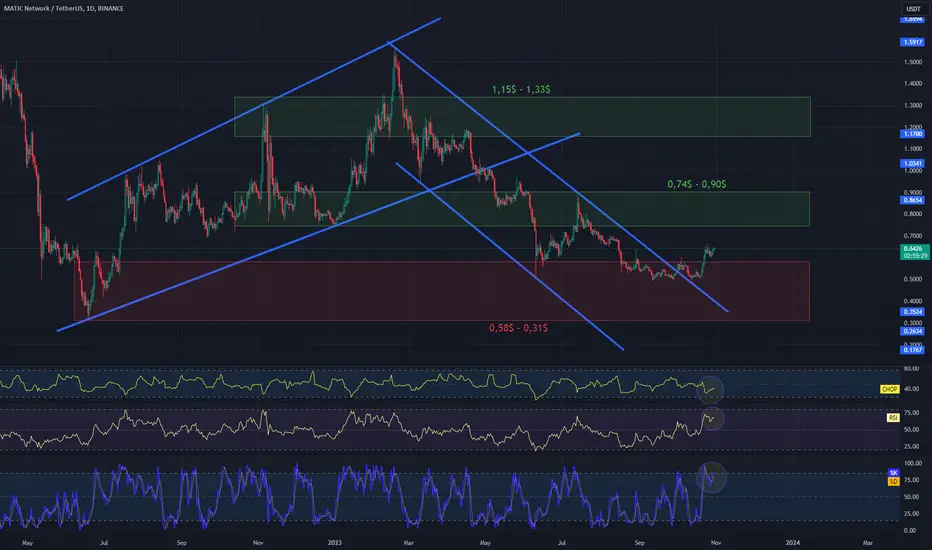
I invite you to review the MATIC chart in pair with USDT. First, we will use the blue lines to mark the upward trend channel from which the price broke out, creating a downward trend channel in which we could currently see the price leaving it with a sideways movement.
When we unfold the Fib Retracement grid, we can see that the price remained at the upper limit, a very strong fundamental support zone from $0.58 to $0.31.
Looking the other way, we can see a significant resistance zone from $0.74 to $0.90, only after we break out of it and then test it positively will we be able to see a further upward movement towards the second zone from $1.15 to $1, $33.
Please look at the CHOP index, which indicates that most of the energy has been used, while the RSI and STOCH indicators show that we are moving at the upper limit, which may negatively affect the price and provide a rebound in the coming days.
When we unfold the Fib Retracement grid, we can see that the price remained at the upper limit, a very strong fundamental support zone from $0.58 to $0.31.
Looking the other way, we can see a significant resistance zone from $0.74 to $0.90, only after we break out of it and then test it positively will we be able to see a further upward movement towards the second zone from $1.15 to $1, $33.
Please look at the CHOP index, which indicates that most of the energy has been used, while the RSI and STOCH indicators show that we are moving at the upper limit, which may negatively affect the price and provide a rebound in the coming days.

免责声明
这些信息和出版物并非旨在提供,也不构成TradingView提供或认可的任何形式的财务、投资、交易或其他类型的建议或推荐。请阅读使用条款了解更多信息。
免责声明
这些信息和出版物并非旨在提供,也不构成TradingView提供或认可的任何形式的财务、投资、交易或其他类型的建议或推荐。请阅读使用条款了解更多信息。