做空
MATICUSD ❕ downtrend
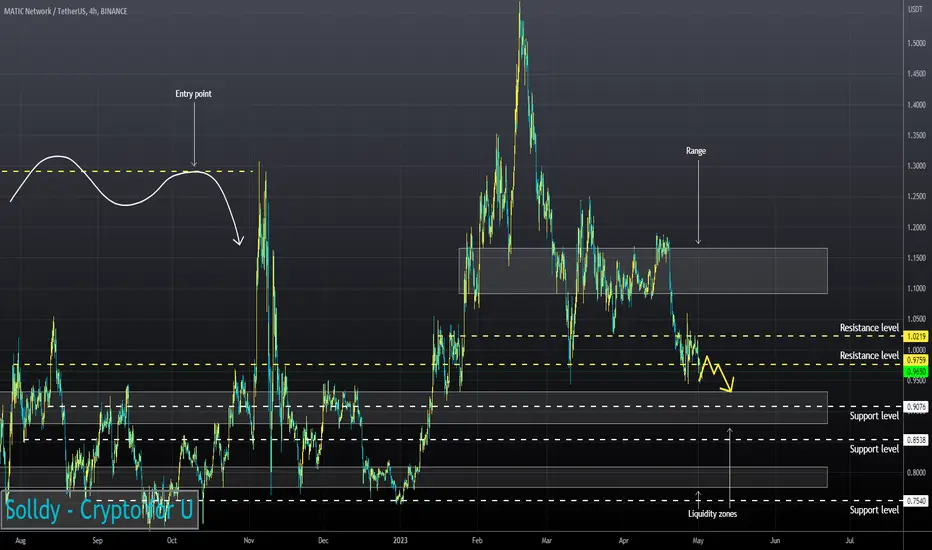
The movement of the RSI chart indicates that the asset continues its movement in a bearish trend and is now testing its upper limit (4H, 1H and 30m TFs)
I believe that the price of the asset will continue to decline if it fixes under the resistance level.
I believe that the price of the asset will continue to decline if it fixes under the resistance level.

免责声明
这些信息和出版物并非旨在提供,也不构成TradingView提供或认可的任何形式的财务、投资、交易或其他类型的建议或推荐。请阅读使用条款了解更多信息。