
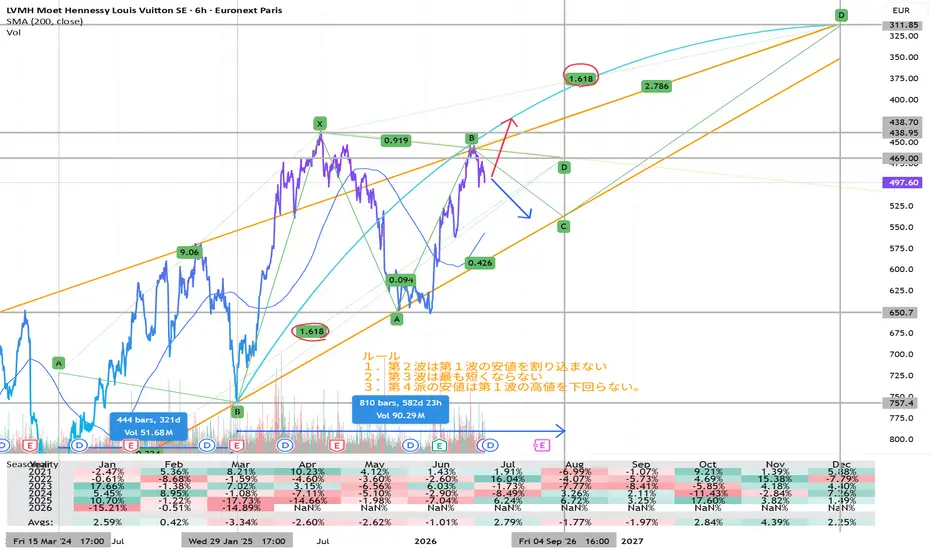
I don’t usually comment on individual stocks, but looking at LVMH’s chart, I’m watching to see whether it breaks above the BD line (red arrow) or below the AC line (blue arrow).
The reason is that the price is currently sitting in a converging structure very close to a mid-term turning point.
In simple terms, the upper BD line and lower AC line are gradually coming together over time, which is compressing volatility. In situations like this, energy tends to build up, and when a breakout finally happens, it often leads to more than just a short-term move—it can develop into a trend change or a stronger directional push.
Also, looking at the recent price action around the swing high (point B), upward momentum is still there, but it hasn’t clearly broken out yet. That suggests a balance between buyers and sellers, and the key point to watch is where that balance breaks—either above BD or below AC.

免责声明
这些信息和出版物并非旨在提供,也不构成TradingView提供或认可的任何形式的财务、投资、交易或其他类型的建议或推荐。请阅读使用条款了解更多信息。