
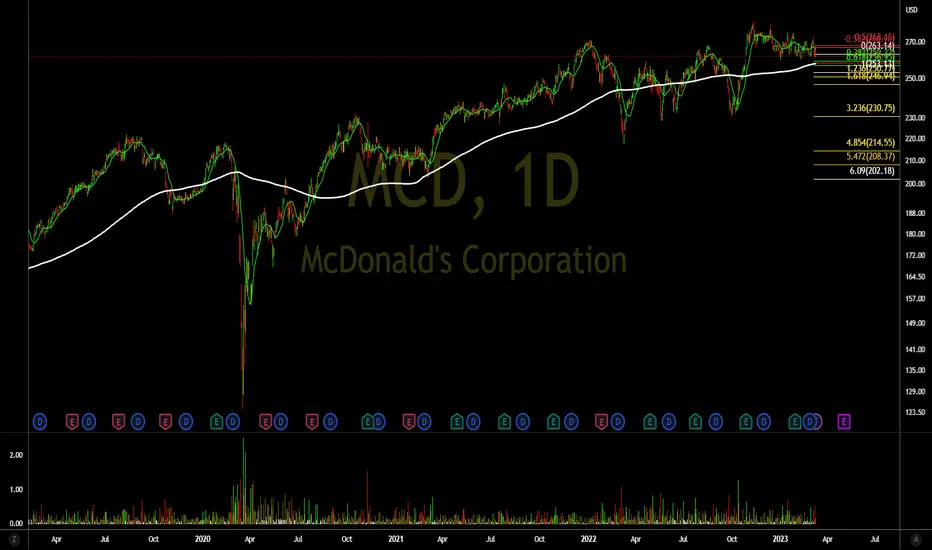
-One of the most promising companies and the largest chain of restaurants in the world (fast food), can it go through corrections?
-If the answer is yes, that means we really could have such a "recession" soon.
-Based on SETUP and graphical analysis, there are some indications that we may have sharper corrections in the asset.
-I believe that long-term investors will want more premiums to buy the asset, mostly due to high inflation and, mainly, due to the monetary tightening that the FED will introduce.
-But this is a controversial thing, after all, when there is a reduction in the purchasing power of the masses, companies like MC DONALDS manage to benefit a lot from the situation. Is this graphic analysis trying to play a trick on me?
-Using the monthly chart, it indicates that the stock is entering a downtrend. Or will it be a correction to the region of $245.37? Or do we have a flag? There are so many variables to consider!

-By the weekly chart and upward trend it lost its strength in December 2022, where it ended up forming a bearish pivot as shown in the image below. We have prices losing and gaining the critical zone of $264.23. If there is a loss in this region, the correction could be towards $241.49 at first.

-Going down a little further, on the daily chart, we have this beautiful bearish pivot almost forming, and its destination according to the SETUP used is much lower. We have the long average at 253.13. Will it be able to help hold prices?

-Honestly, I hope I'm totally wrong!
-Do your analysis and good business.
-Be Aware, If You Buy, Use Stop!
-See below for other graphic analysis!
-If the answer is yes, that means we really could have such a "recession" soon.
-Based on SETUP and graphical analysis, there are some indications that we may have sharper corrections in the asset.
-I believe that long-term investors will want more premiums to buy the asset, mostly due to high inflation and, mainly, due to the monetary tightening that the FED will introduce.
-But this is a controversial thing, after all, when there is a reduction in the purchasing power of the masses, companies like MC DONALDS manage to benefit a lot from the situation. Is this graphic analysis trying to play a trick on me?
-Using the monthly chart, it indicates that the stock is entering a downtrend. Or will it be a correction to the region of $245.37? Or do we have a flag? There are so many variables to consider!
-By the weekly chart and upward trend it lost its strength in December 2022, where it ended up forming a bearish pivot as shown in the image below. We have prices losing and gaining the critical zone of $264.23. If there is a loss in this region, the correction could be towards $241.49 at first.
-Going down a little further, on the daily chart, we have this beautiful bearish pivot almost forming, and its destination according to the SETUP used is much lower. We have the long average at 253.13. Will it be able to help hold prices?
-Honestly, I hope I'm totally wrong!
-Do your analysis and good business.
-Be Aware, If You Buy, Use Stop!
-See below for other graphic analysis!

相关出版物
免责声明
这些信息和出版物并非旨在提供,也不构成TradingView提供或认可的任何形式的财务、投资、交易或其他类型的建议或推荐。请阅读使用条款了解更多信息。