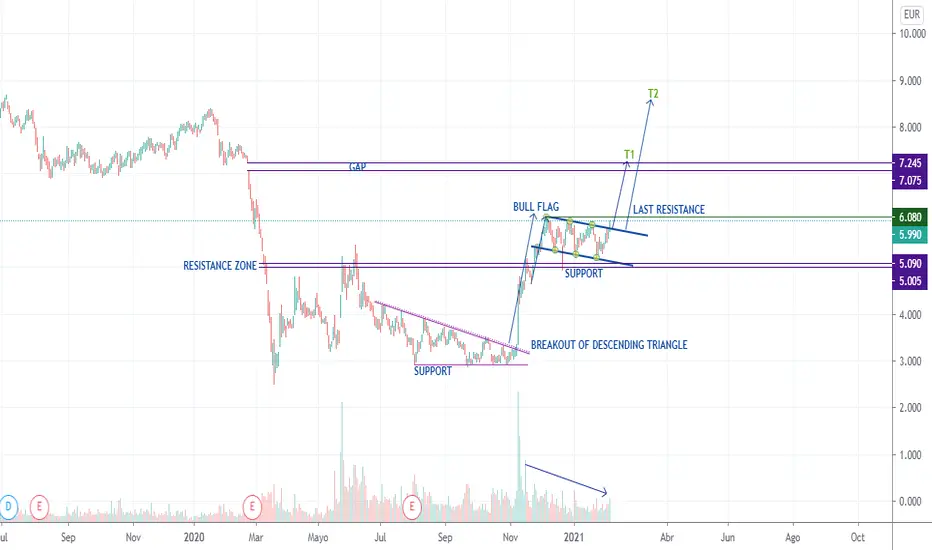
After a big advance shown by the price in November and December of 2020, the stock began to oscillate between two parallel lines with a negative slope forming a bull flag. Now, in recent days, the price has escaped form this flag and the first projection goes to 7.10 euros, which coincides with the gap of February 24, 2020.
During the formation of the flag we have:
Decreasing volume.
Fast and bullish previous trend.
A flag bounded by two parallel lines in the opposite direction to the previous trend.
 MEL
MEL
During the formation of the flag we have:
Decreasing volume.
Fast and bullish previous trend.
A flag bounded by two parallel lines in the opposite direction to the previous trend.
MEL
免责声明
这些信息和出版物并非旨在提供,也不构成TradingView提供或认可的任何形式的财务、投资、交易或其他类型的建议或推荐。请阅读使用条款了解更多信息。
免责声明
这些信息和出版物并非旨在提供,也不构成TradingView提供或认可的任何形式的财务、投资、交易或其他类型的建议或推荐。请阅读使用条款了解更多信息。